Disclaimer
Information provided on this website is general in nature and does not constitute financial advice. Every effort has been made to ensure that the information provided is accurate. Individuals must not rely on this information to make a financial or investment decision. Before making any decision, we recommend you consult a financial adviser to take into account your particular investment objectives, financial situation and individual needs.
Weekly Market Update – 7th February 2025

Investment markets and key developments
The week was dominated by ongoing announcements from the Trump administration. After only being in office for 2½ weeks Trump and his team have been busy making changes (not including legislation which requires votes from the House and Senate) and appear much more coordinated compared to 2017. This week’s changes included everything from tariffs (more on that below), Elon Musk’s D.O.G.E department shedding Federal workers, a dismantling in USAID and Trumps plans for the US to rebuild Gaza. Some of the initial announcements from Trump can sound absurd and comical, but there is always some meaning for US policy the comments, even if the actual decisions get watered down. A great quote from Dominic Green in the Australian Financial Review said “Trump always means what he says, but what he says isn’t always what he means. He is an erratic personality but a consistent character”. This is good to keep in mind when trying to analyse his announcements!
Given the strong position of the US economy and share markets, significant momentum behind Trump and his team given the Red Sweep and popular vote, Trump is capitalising on this strong position and getting things done quickly. And despite everything going on, markets have not had large drawdowns. The US S&P500 fell by 0.2% over the week after high inflation expectations data at the end of the week but the S&P500 is still close to a record high. The ASX200 is also down 0.2% but has outperformed the US in recent periods, Eurozone shares are up by 0.7% and are around a record high, Japanese shares were down and Chinese shares were higher but were closed earlier in the week for the Lunar New Year holiday. The US dollar remains strong and the $A remains under 0.63 USD, its lowest level since 2003 (outside of the pandemic) with a move below 0.60 possible. US 10-year bond yields have settled back down to just under 4.5% and the gold price is still around a record high.
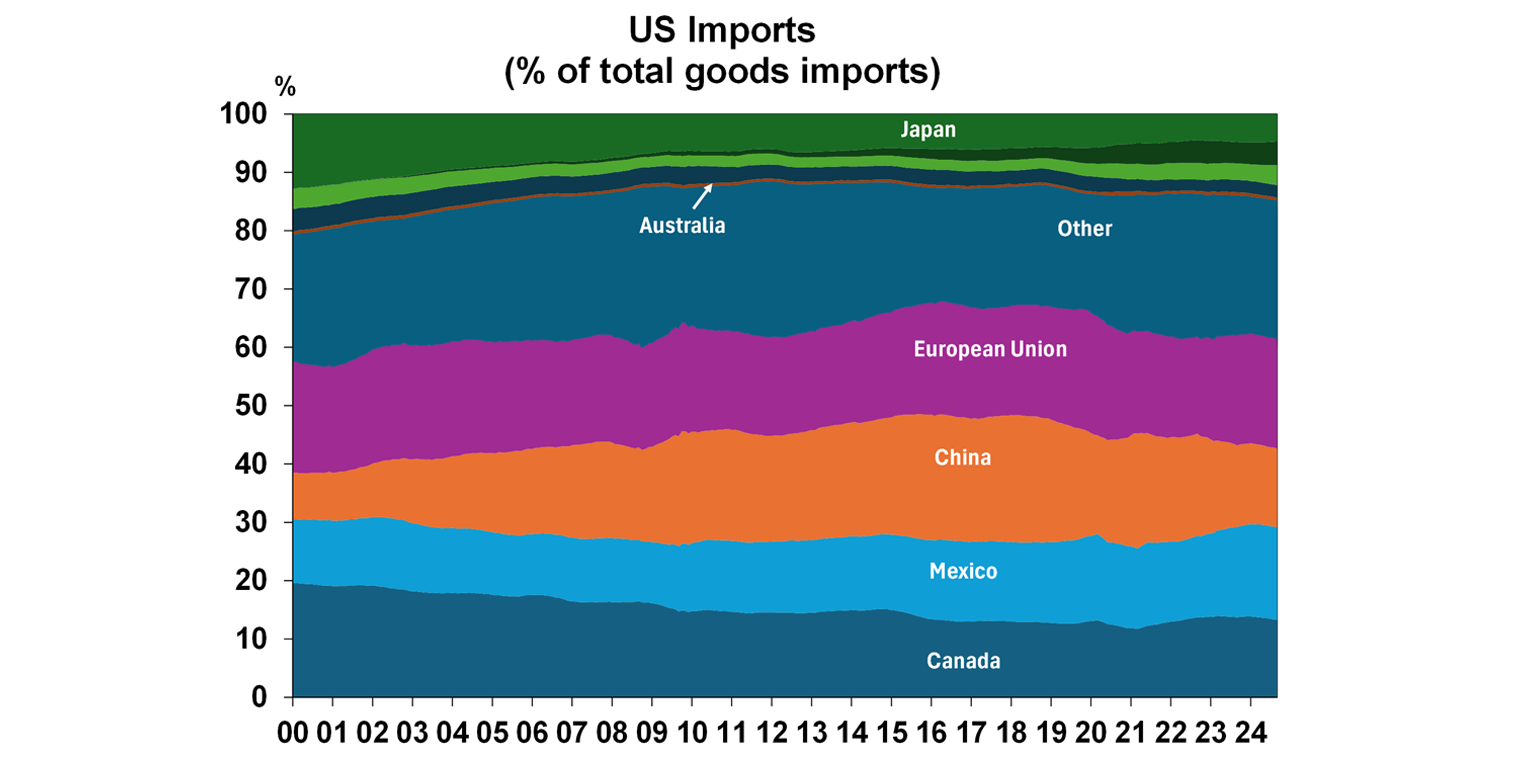
What is happening with tariffs? Our Chief Economist Shane Oliver wrote in detail about it here. To summarise, Trump announced a 25% tariff on Canada (with a lower 10% on Canadian energy), 25% on Mexico and 10% China and threatened more and on other countries too (like the European Union) but has since negotiated a 1-month delay to tariffs with Canada and Mexico, with both countries agreeing to additional border patrols to stem illegal immigration and drug flows into the US. Around 42% of US imports come from Canada, Mexico and China. The US mainly imports energy, agriculture and motor vehicles from Canada and Mexico and machinery & transport and manufactured items from China.
US tariffs on China tariffs have begun and China has retaliated with announcing tariffs on $15bn of US goods imports (this is small relative to the $430bn the US is targeting). President Xi and Trump are due to talk in coming days so these tariffs may be negotiated down, away or postponed.
How will tariffs impact the US and the levied countries? If Trump’s tariffs on Canada, Mexico and China go through this would take the average US tariff rate up from ~3% to 10% (see the chart below), the highest since 1946 and much bigger than Trump 1.0 tariffs. This would be a big negative for global trade growth, but we think it’s unlikely that tariffs will actually reach this level. Given what’s happened in the last week, it is clear that Trump doesn’t necessarily want to impose significantly higher costs for US consumers with tariffs given that he doesn’t want the share-market to fall too much and still wants to win in the US midterms.

Source: US ITC, Evercore ISI, AMP. Trump 2.0 assumes 10% general tariff and 50% on China.
There is a lot of confusion around who actually pays for the tariff, with Trump saying that the foreigners pay the US government this levy. This isn’t accurate. A tariff is a tax. The tax is levied on the importer who pays the tax to the government. The importer may ask the exporter for a cheaper price or decide to fully or partially pass the cost down the supply chain until it reaches the consumer. Higher imported goods prices are meant to push consumers to substitute to cheaper (perhaps local) products. But often local products are more expensive than imported alternatives. The foreigner “pays” if their revenue and goods sold declines.
The issue for markets is that tariffs lead to consumer and business uncertainty, weaken trade channels weighing on GDP growth and lift consumer prices which could prevent interest rate cuts. Share markets have not fully factored in potential tariff risks because this is up to Trump and his team! In the near-term expect more volatile moves in equity markets off tariff news, risk of moderate falls in shares and a higher US dollar from the risk of tariff-driven inflation.
What do tariffs mean for us in Australia? There are 3 things to keep in mind.
- Australia has little direct trade with the US. 0.5% of US imports are from Australia (see the next chart). So any tariffs targeted towards Australia will be small, but could still happen for specific commodity exports like aluminium and lithium.
Source: Bloomberg, AMP
- The main indirect impact to Australia from tariffs is via lower commodity to China, from any disruption to Chinese growth (as our main trading partner). A slowdown in the global economy would also be negative for Australian trade as we are a small, open economy. But in this scenario, China is also likely to push through fiscal spending to offset any economic disruption to which Australian commodities would benefit. There may also be some positive opportunities for Australian businesses to export to the US if the US pivots away from Canada, Mexico and China.
- There is a financial market implication for Australia as well which we can already see with the lower Aussie dollar and equity market volatility.
There are clearly a lot of ways that the tariff situation can evolve based on new policy announcements. Our view is that global economy growth is still holding up well, inflation has further to fall (despite some short-term upside from tariffs) and interest rates will be cut further which provides a positive backdrop for share markets, although returns will be lower compared to 2024 and a decent draw-down is likely this year due to the fluid policy backdrop.
Major global economic events and implications
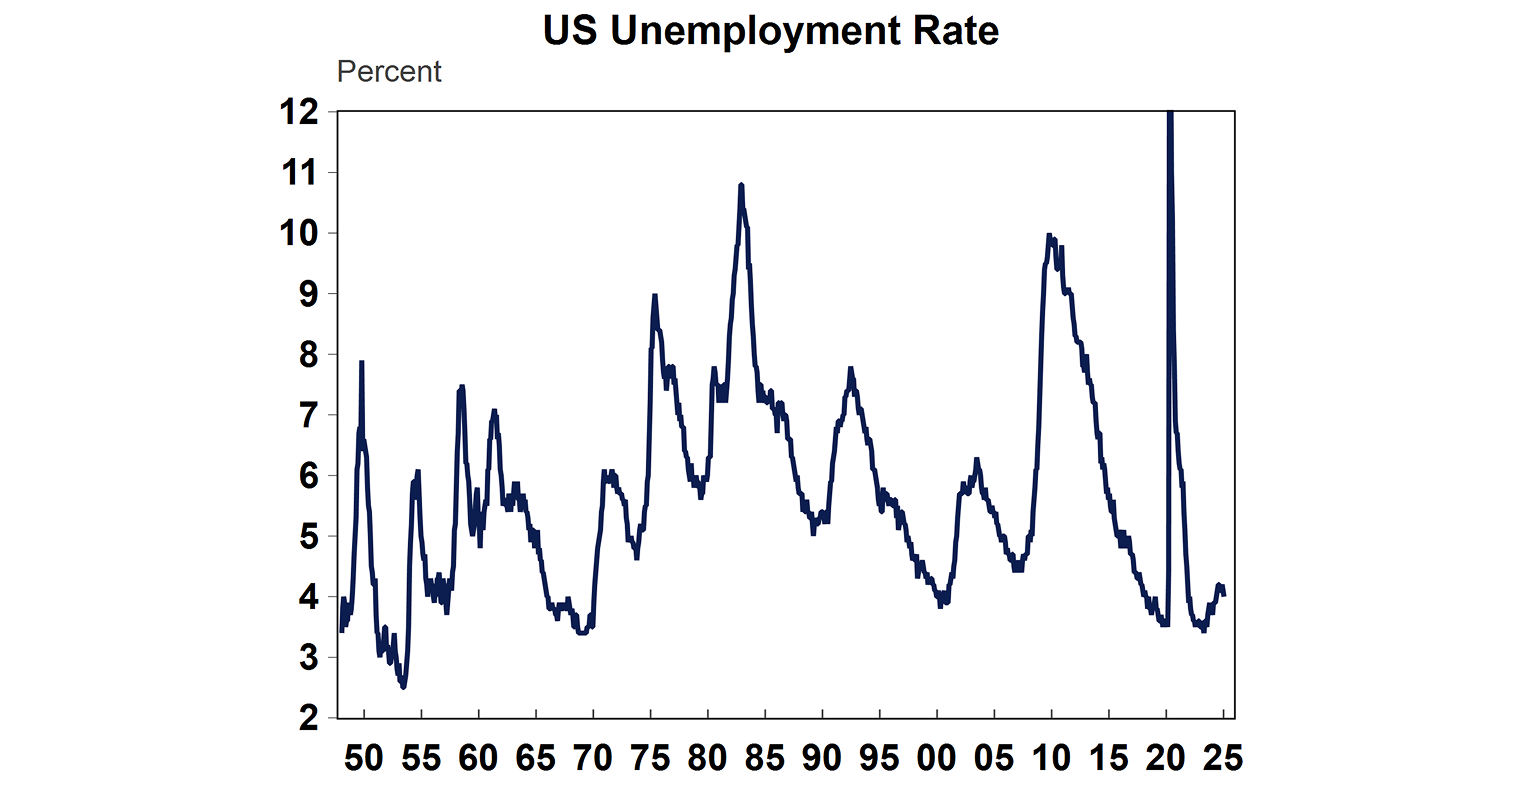
US January non-farm payrolls were mixed. Headline payrolls rose by 143K over the month, below the 175K expected. Jobs growth in recent months was revised up but jobs over 2024 were revised down because of changes to population estimates (2024 jobs growth now shows an average of 166K, from initial estimates of 186k). Economists were expecting downward revisions to jobs growth and the revisions were better than expected. The unemployment rate eased to 4% in January from 4.1% last month and wages growth was also stronger, up 0.5% over the month or 4.1% over the year. The US labour market remains in a solid shape and if it retightens significantly, this will prevent the Fed from cutting too much further.
Source: Macrobond, BLS, AMP
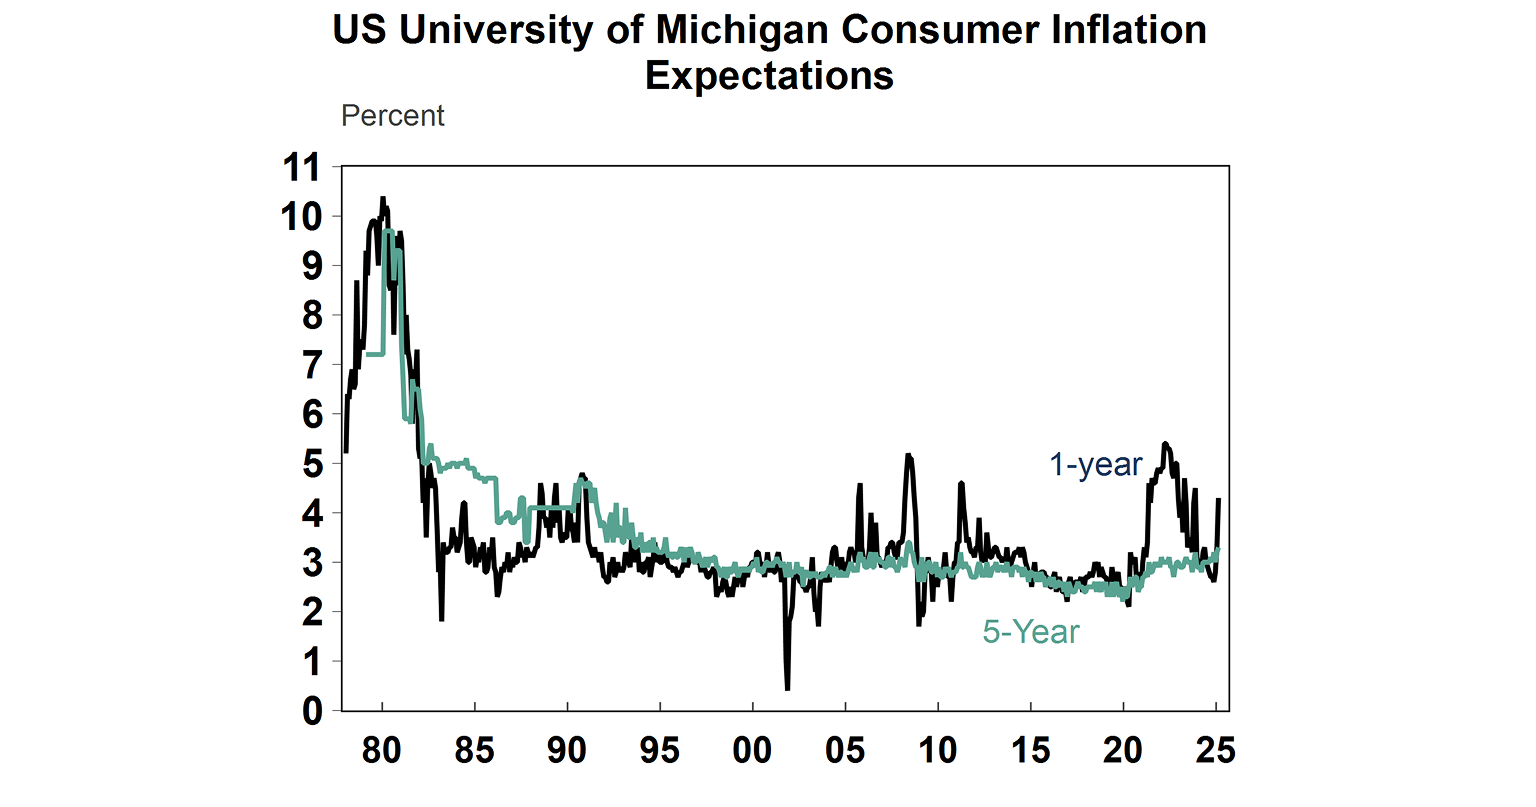
The February Preliminary University of Michigan consumer inflation expectations report was concerning. 1-year inflation expectations skyrocketed to 4.3% from 3.3% last month, due to concerns about tariffs. This is a big change in monthly inflation expectations and only the 5th time in 14 years that such a large monthly jump has been recorded. 5-10 year inflation expectations rose to 3.3% from 3.2%. This will be a problem for the Fed if it continues.
Source: Macrobond, AMP
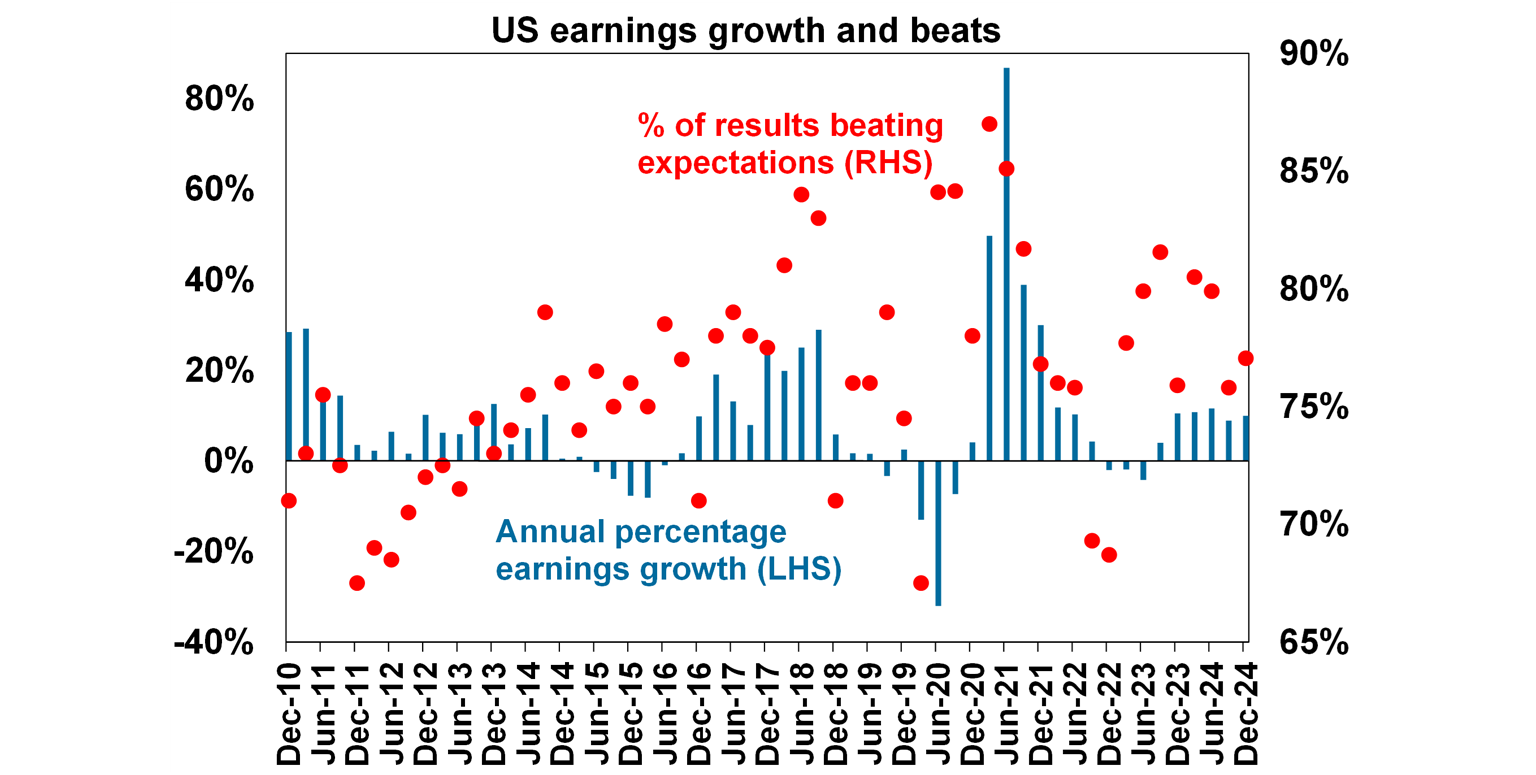
US December quarter earnings season is still ongoing. Around 61% of companies have reported results. 77% of companies have surprise on the upside, above the long-run average of 76%. Annual earnings growth was up by around 10% in December and is expected to be up 13% in 2025.
Source: Bloomberg, AMP
The US manufacturing ISM index rose to 50.9 in January (above 50 means expanding activity and below 50 is contracting activity), its strongest level since September 2022 and closer to the stronger readings given from the PMI (see chart below), a good sign for manufacturing activity.
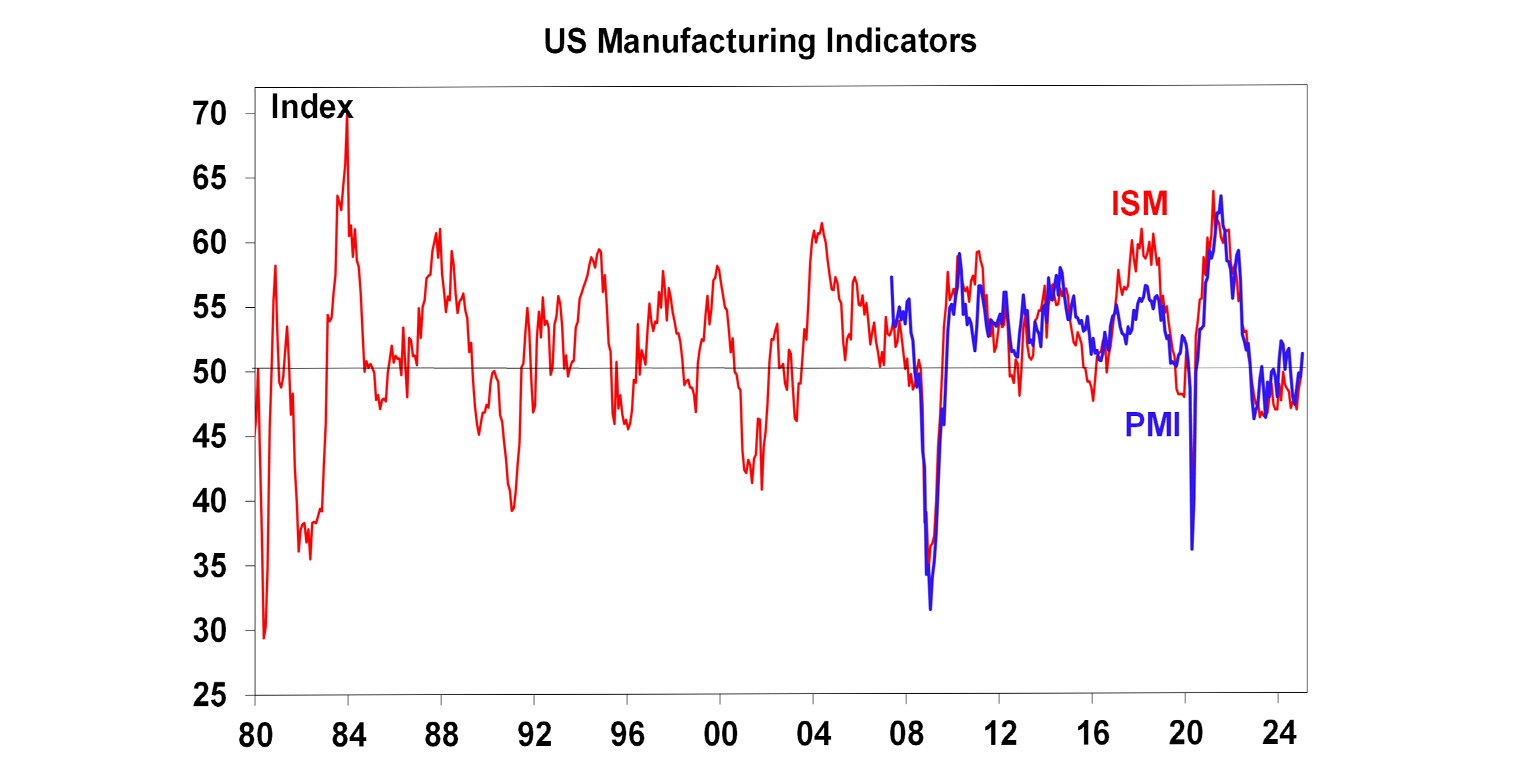
Source: Bloomberg, AMP
The US services ISM index slowed to 52.8 (from 54.0 last month) and is in line with the services PMI reading. Services activity has been outpacing manufacturing, but is now slowing.

Source: Bloomberg, AMP
US job openings fell to 7.6mn, below expectations with the ratio of job openings to the number of people unemployed declining to 1.1, back to pre-Covid norms.
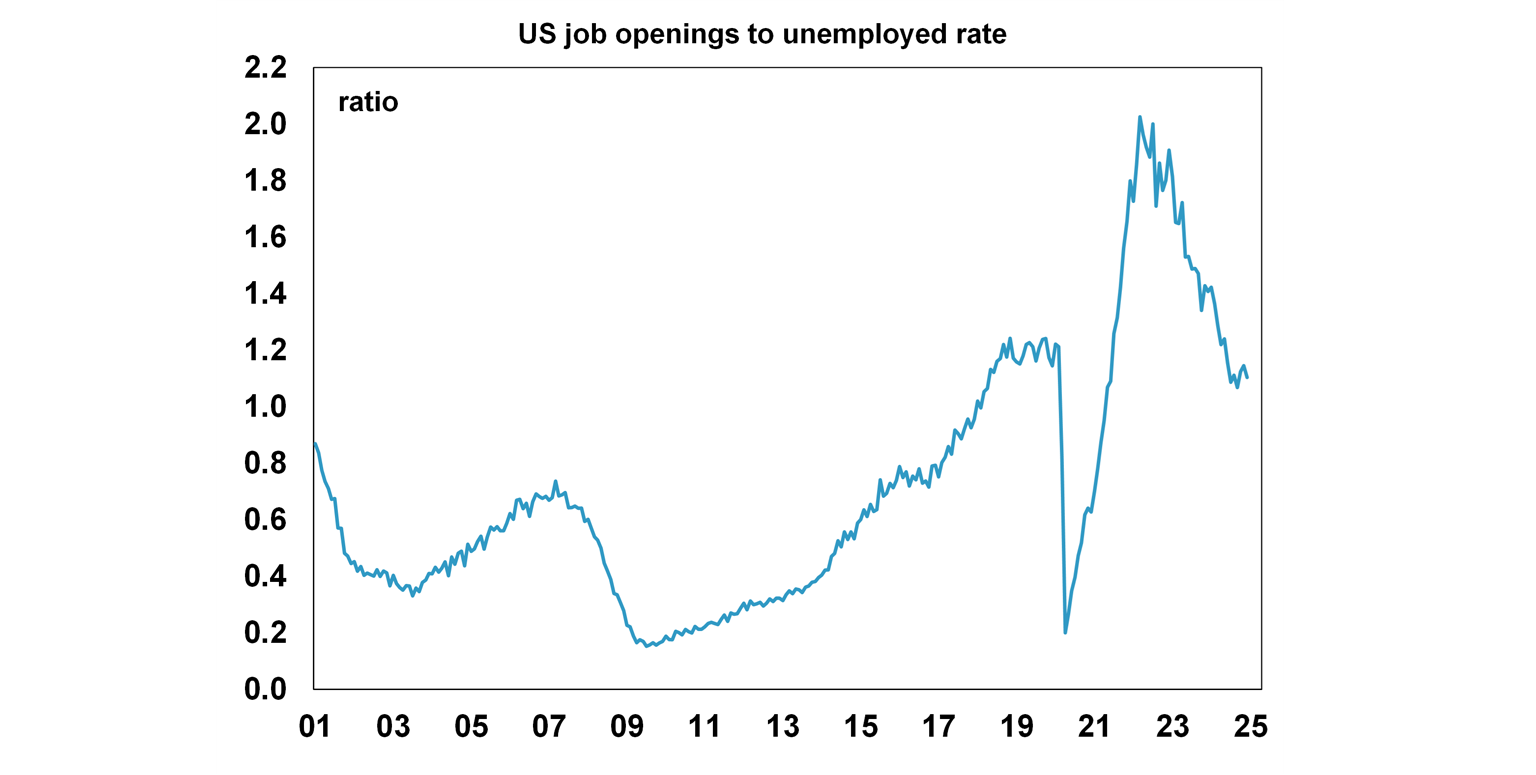
Source: Bloomberg, AMP
The US jobs quits rate fell to 2%, around its lowest level since 2016 (outside the pandemic) which means that less employees are quitting their jobs, usually a sign that the labour market has slowed.

Source: Macrobond, AMP
And the job hires rate was unchanged at 3.4% (new hires as a share of employment), well below its long-run average (see the chart below) and close to an 11-year low (outside the pandemic)
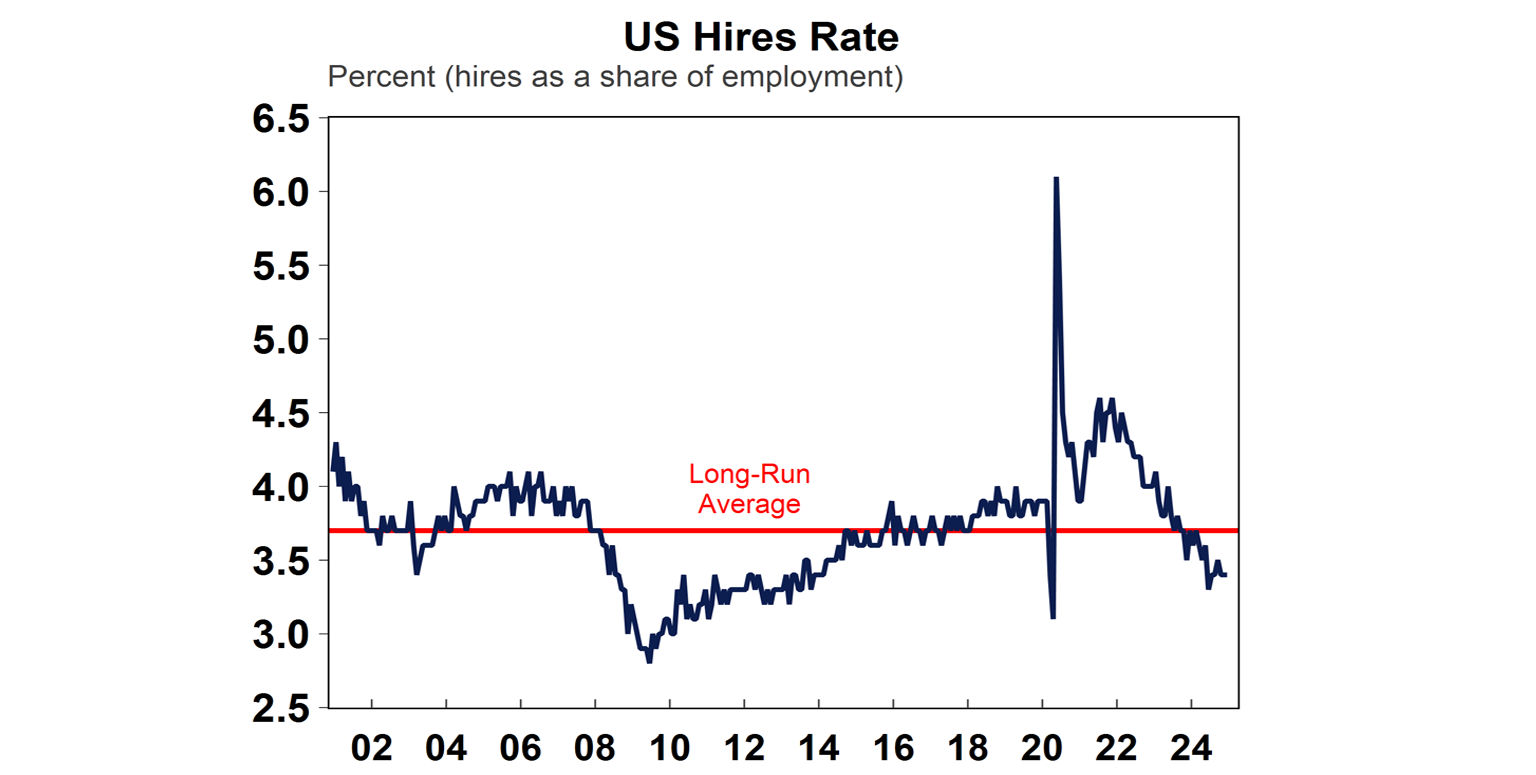
Source: Macrobond, AMP
US lending standards according to the Fed Loan Officer survey showed an overall further loosening in lending standards and has fallen a lot from post 2023 banking crisis levels (see chart below), especially for commercial & industrial loans and commercial real estate.
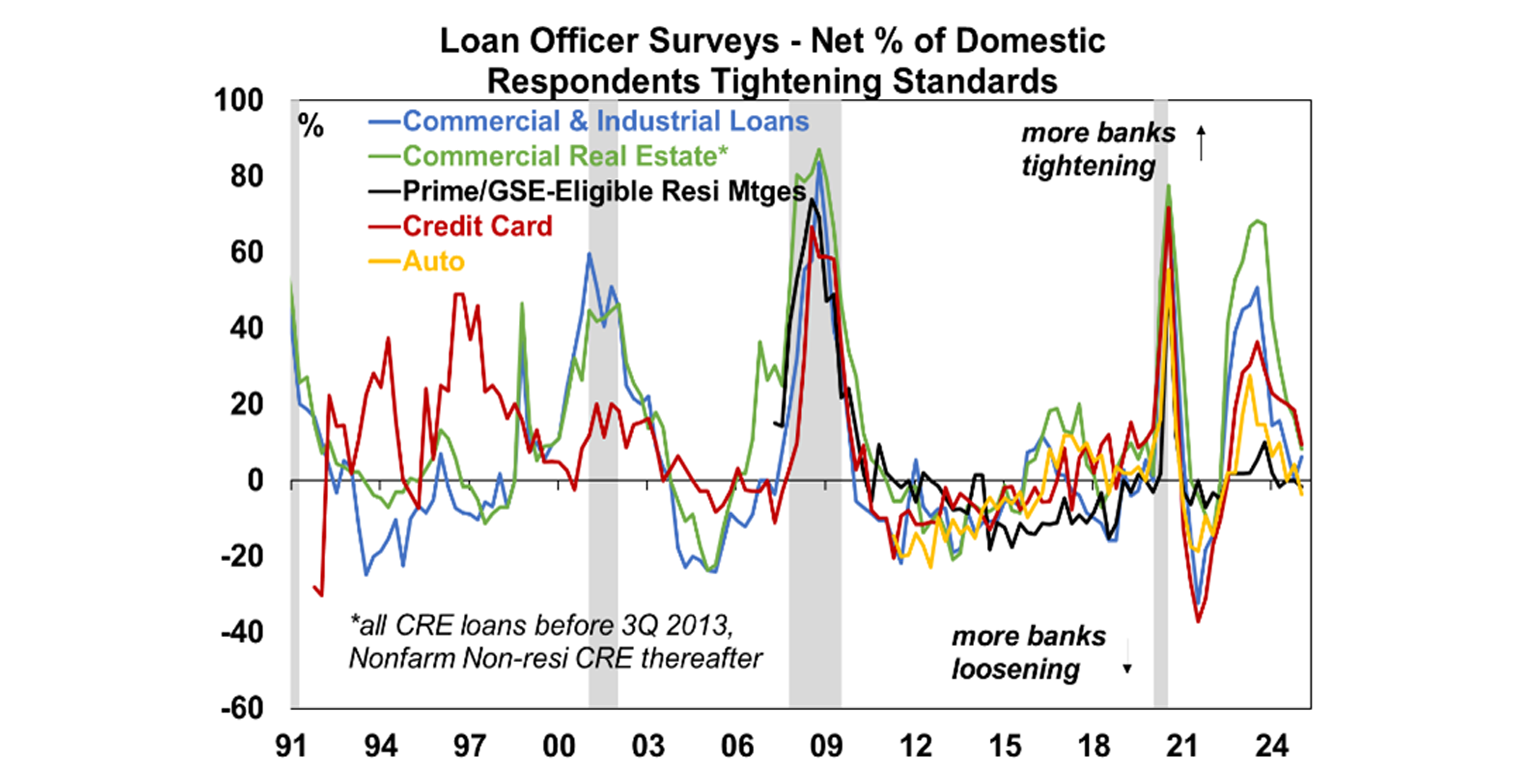
Source: Bloomberg, AMP
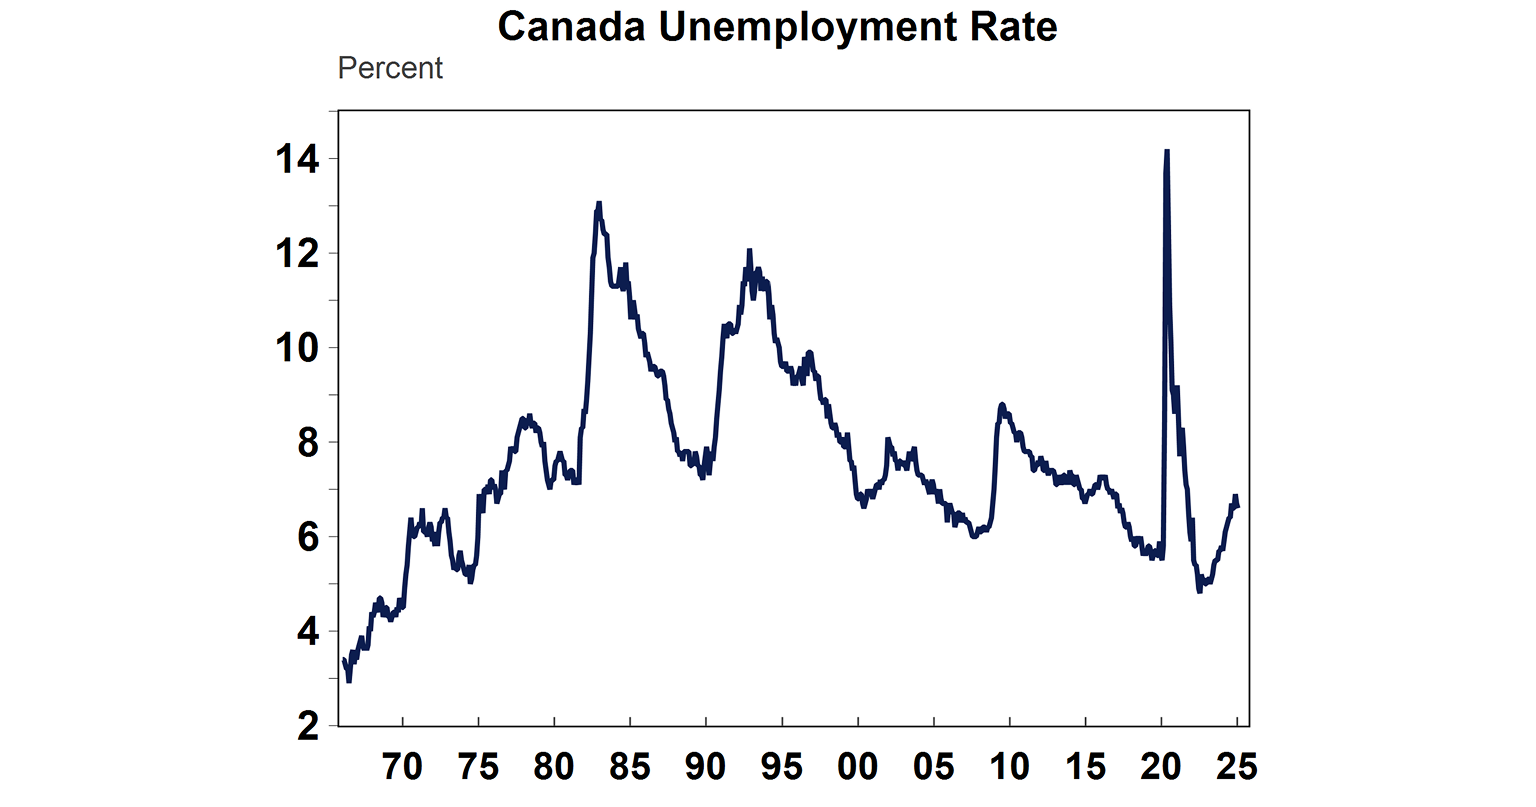
Some better news on Canadian employment. Employment increased by 76K in January, better than the 25K expected. The unemployment rate decreased to 6.6% while expectations were looking for an increase. There are early signs that the Canadian labour market is stabilising.
Source: Macrobond, AMP
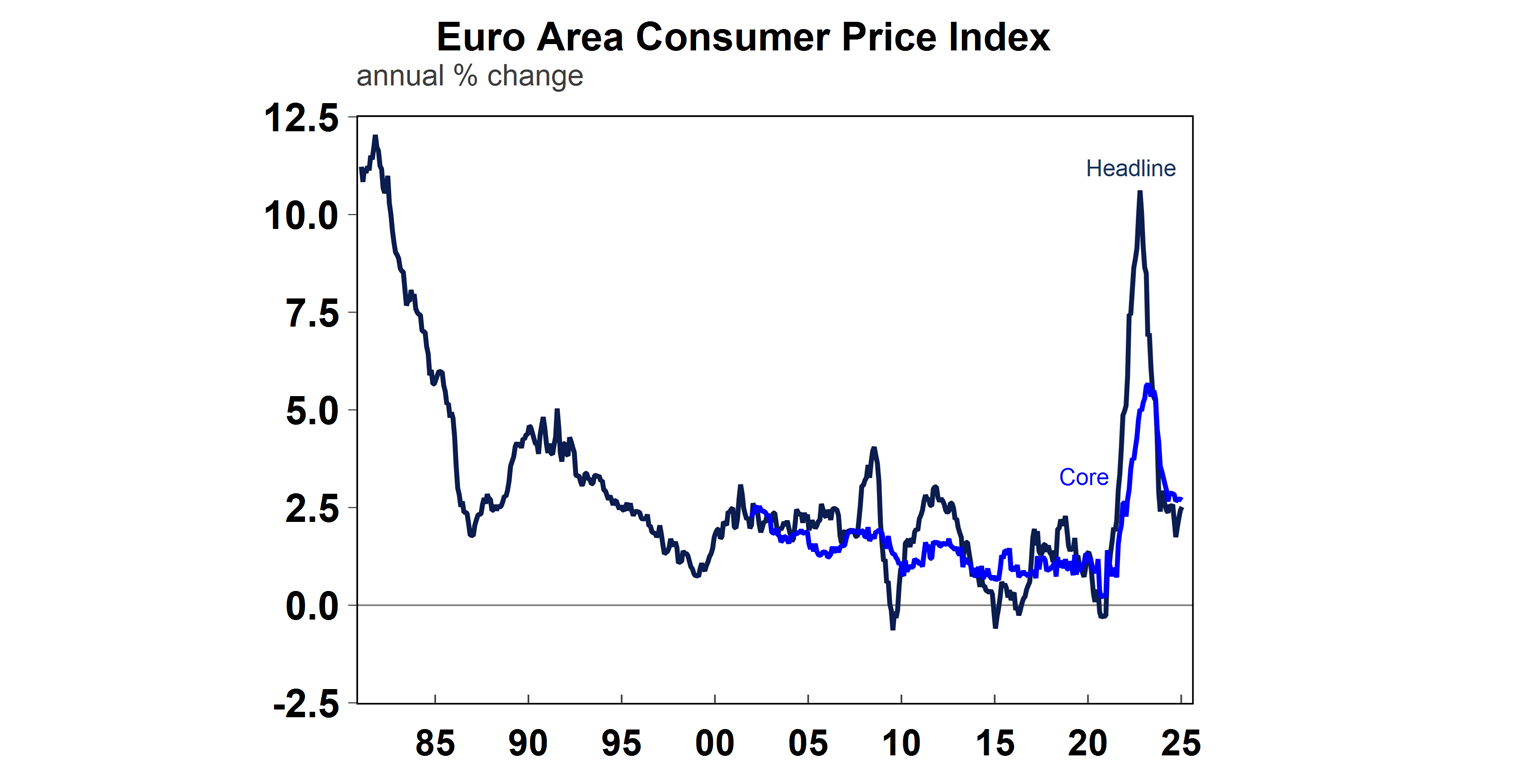
The Eurozone January consumer price data showed a fall in the monthly inflation read, with annual growth up to 2.5% and core inflation at 2.7%. The outlook for Eurozone inflation is to the downside as economic growth is stagnant and wages growth is slowing.
Source: Macrobond, AMP
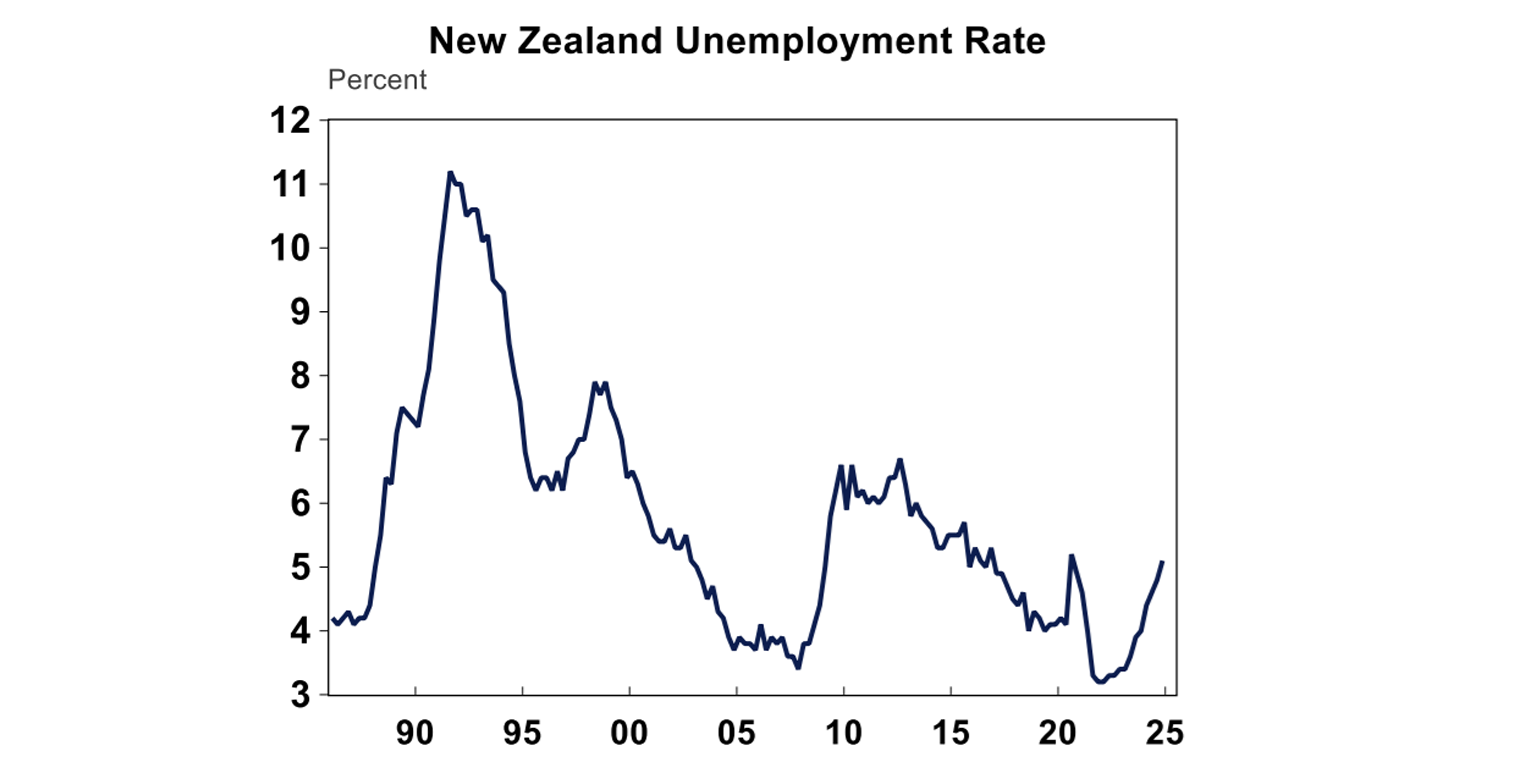
The New Zealand unemployment rate rose to 5.1% in the December quarter and employment growth, back to ~ 2017 highs (outside of the pandemic).
Source: Macrobond, AMP
The Bank of England cut interest rates by 0.25%, to 4.5%. The BoE has cut rates by 0.75% in total in this easing cycle, but two voters wanted a higher 0.5% cut which made this move a “dovish cut”. The Bank of England is expected to cut rates a few more times this year.
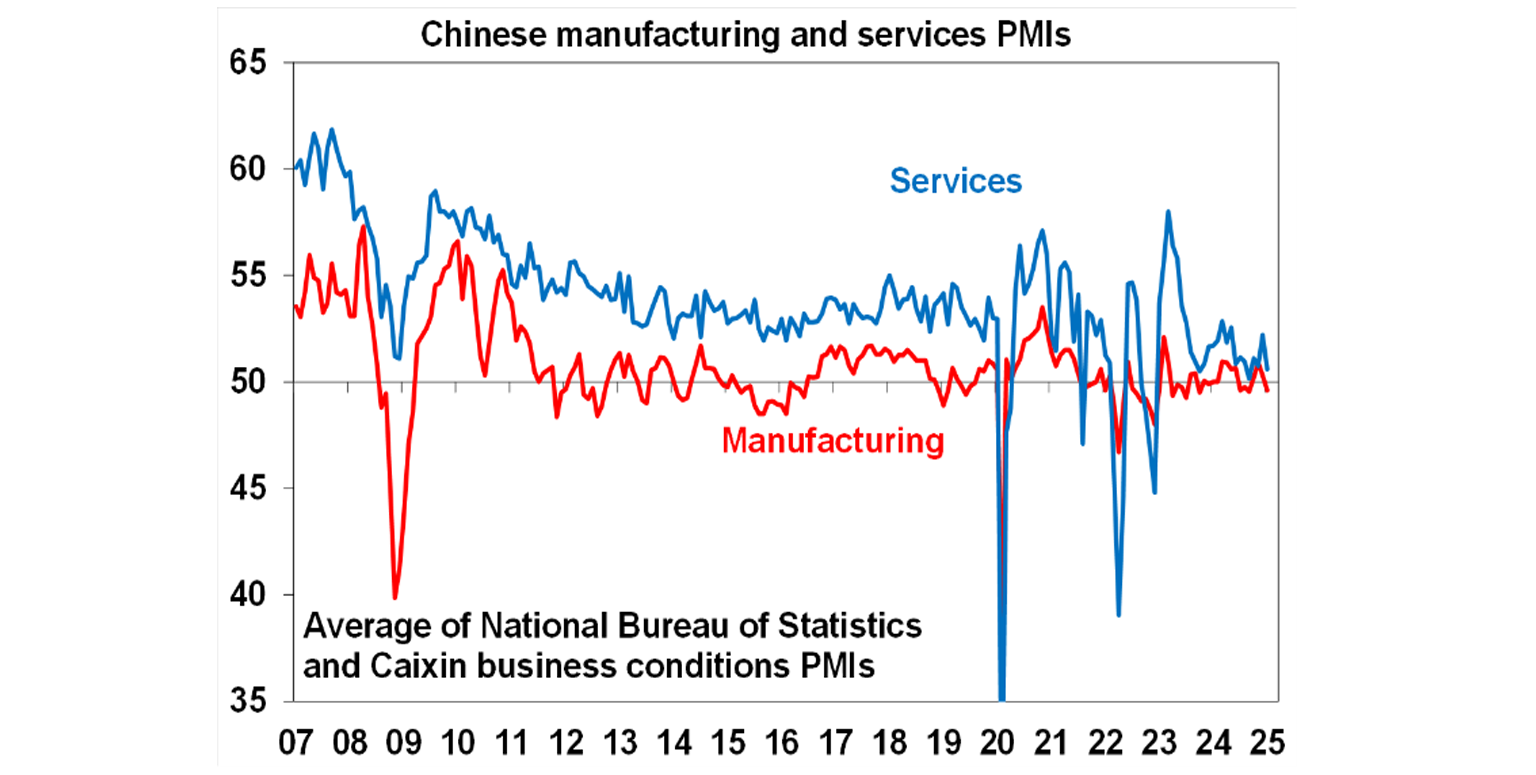
The Chinese Caixin PMI for January was just in expansion at 50.1, a tad below expectations. Services was 51.0, also a bit below expectations and consistent with sluggish growth in the Chinese economy.
Source: Bloomberg, AMP
Australian economic events and implications
Monthly CoreLogic home price figures showed flat growth in January, with a continued fall in capital city prices but a rise in the regions. Annual growth in prices is up by 4.3%. The property market is very diverse in Australia – Melbourne, Sydney and Canberra are seeing prices fall while hot markets like Brisbane, Adelaide and Perth are still seeing positive but slowing gains. Melbourne prices are down by nearly 7% from their peak and the median dwelling value has fallen to $772,371 with the median dwelling less in Melbourne now cheaper than Brisbane, Adelaide, Perth and Canberra! The downturn in property price momentum reflects poor affordability from high home prices and interest rates as well specific tax changes in Victoria which have hit the market there. We expect average property prices to rise around 3% this year.
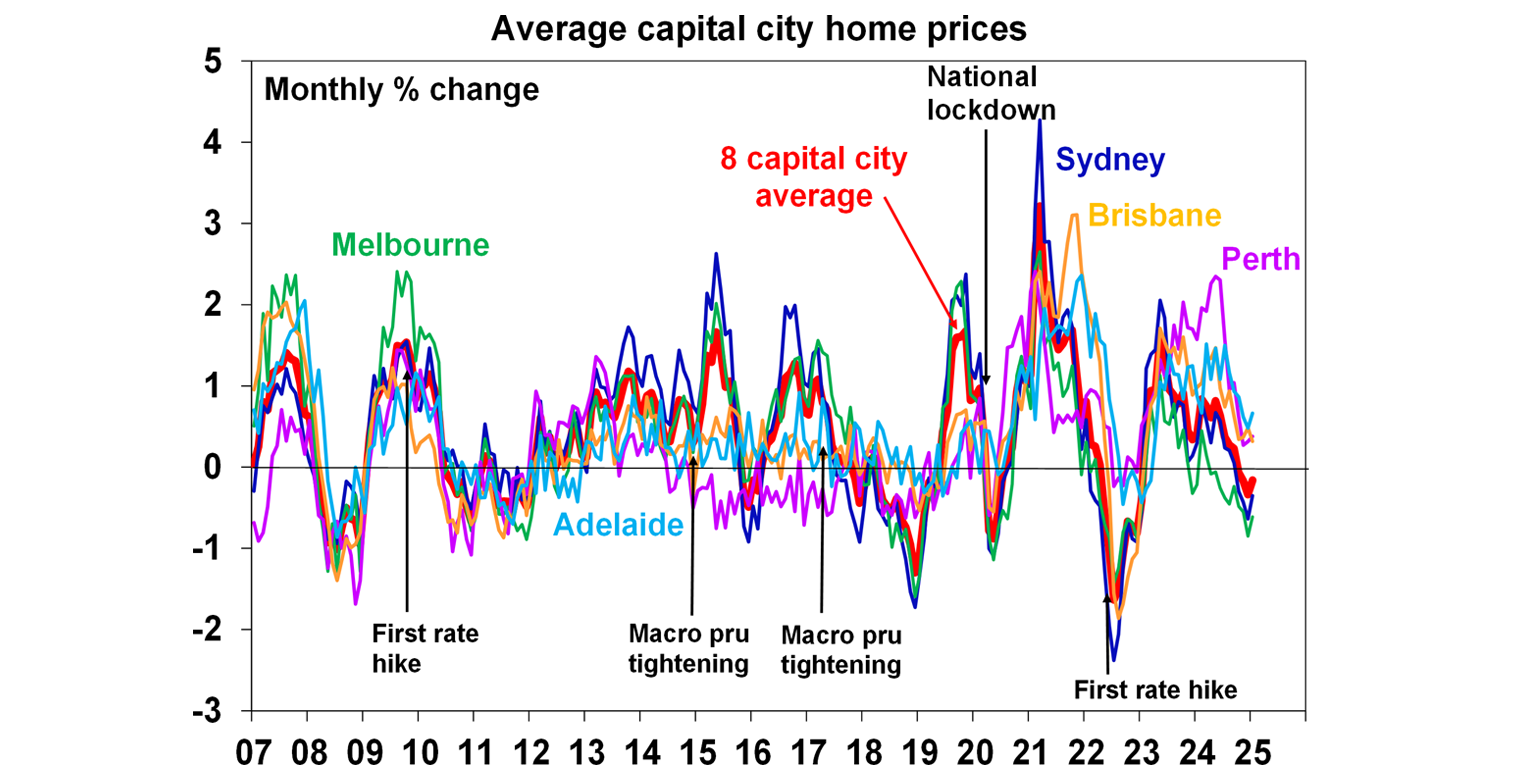
Source: CoreLogic, AMP
More good news on inflation with the monthly Melbourne Institute inflation gauge up 0.1% in January, or 2.3% over the year with the trimmed mean up by 2.6% (the average over the last 3 months) which suggests more downside to inflation.
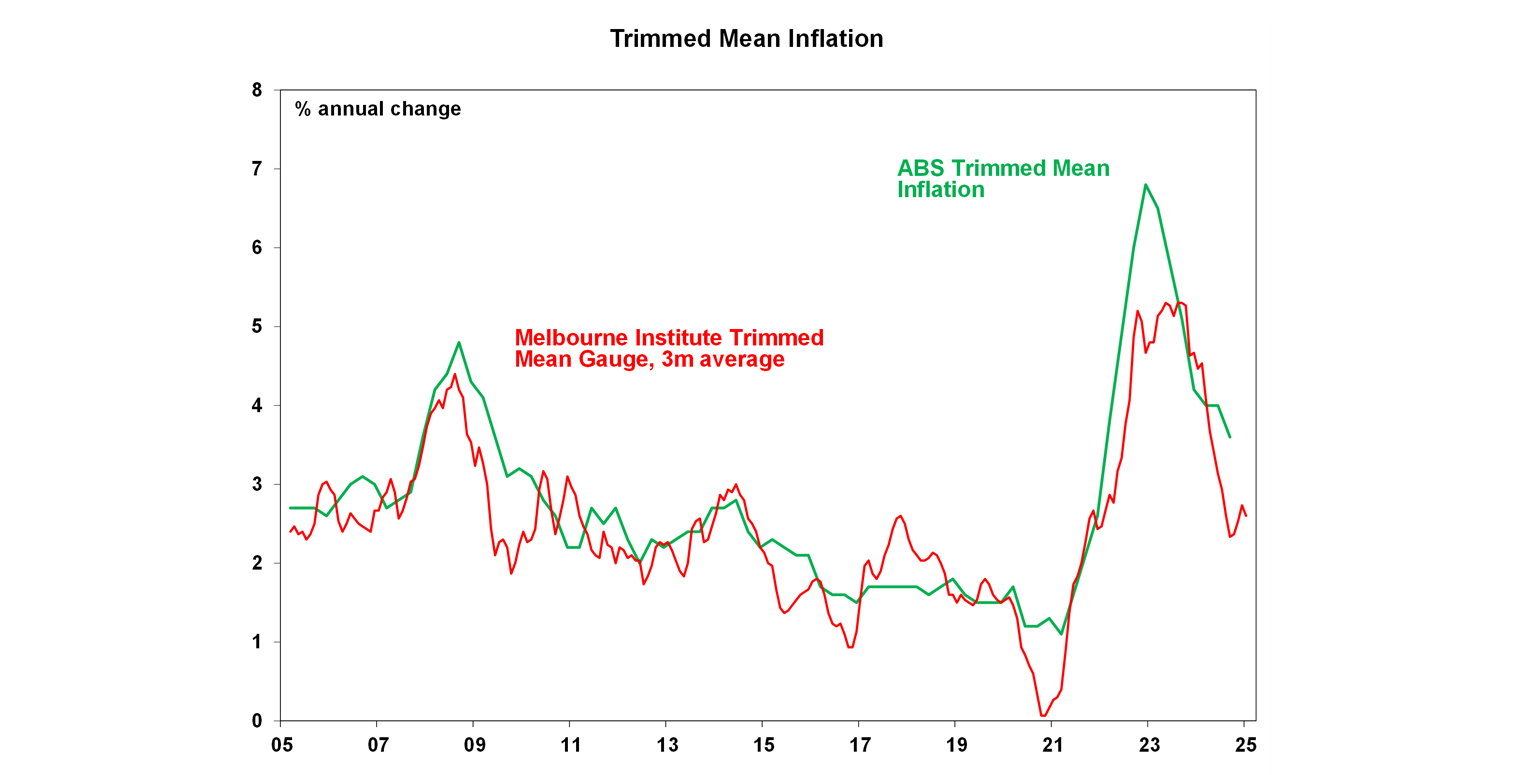
Source: Bloomberg, AMP
ANZ job advertisements rose by 0.2% in January and have been trending up in recent months, although are still down by 15.1% compared to a year ago which shows that the labour market has loosened.
We got two consumer spending updates. Firstly, December retail spending fell by 0.1% in December which was better than expectations of -0.7%. Retail spending has dipped in December in recent years after consumers front-loaded spending in October/November to make use of sales and these changes in spending habits are not yet reflected in the usual seasonal adjustment process. Retail volumes rose by 1% in the December quarter, and will add 0.3 percentage points to December quarter GDP growth. And on a per capita basis, volumes rose by 0.5% for the first time in 2½ years! The other consumer update we got was the monthly household spending data was the monthly household spending data (a more complete picture of consumer spending), which rose by 0.4% in December or 4.3% in December, also showing improving consumer spending.
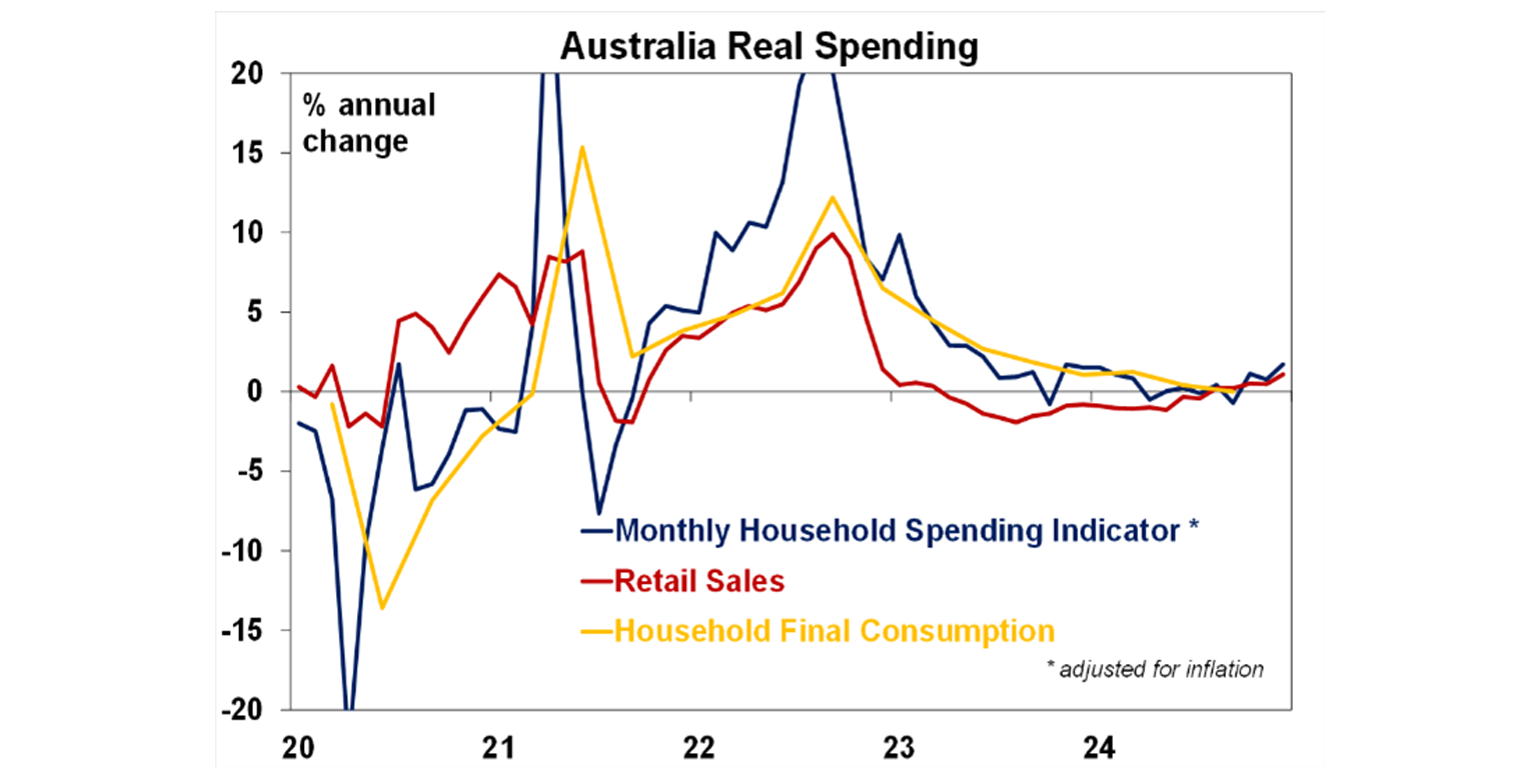
Source: Bloomberg, AMP
Building approvals were 0.7% higher in December, just missing consensus forecasts of 1%. On a quarterly annualised basis, approvals were running at 183K per annum, up from the lows post-pandemic but still below the 240K target (a soft target set by the government in the National Housing Accord).
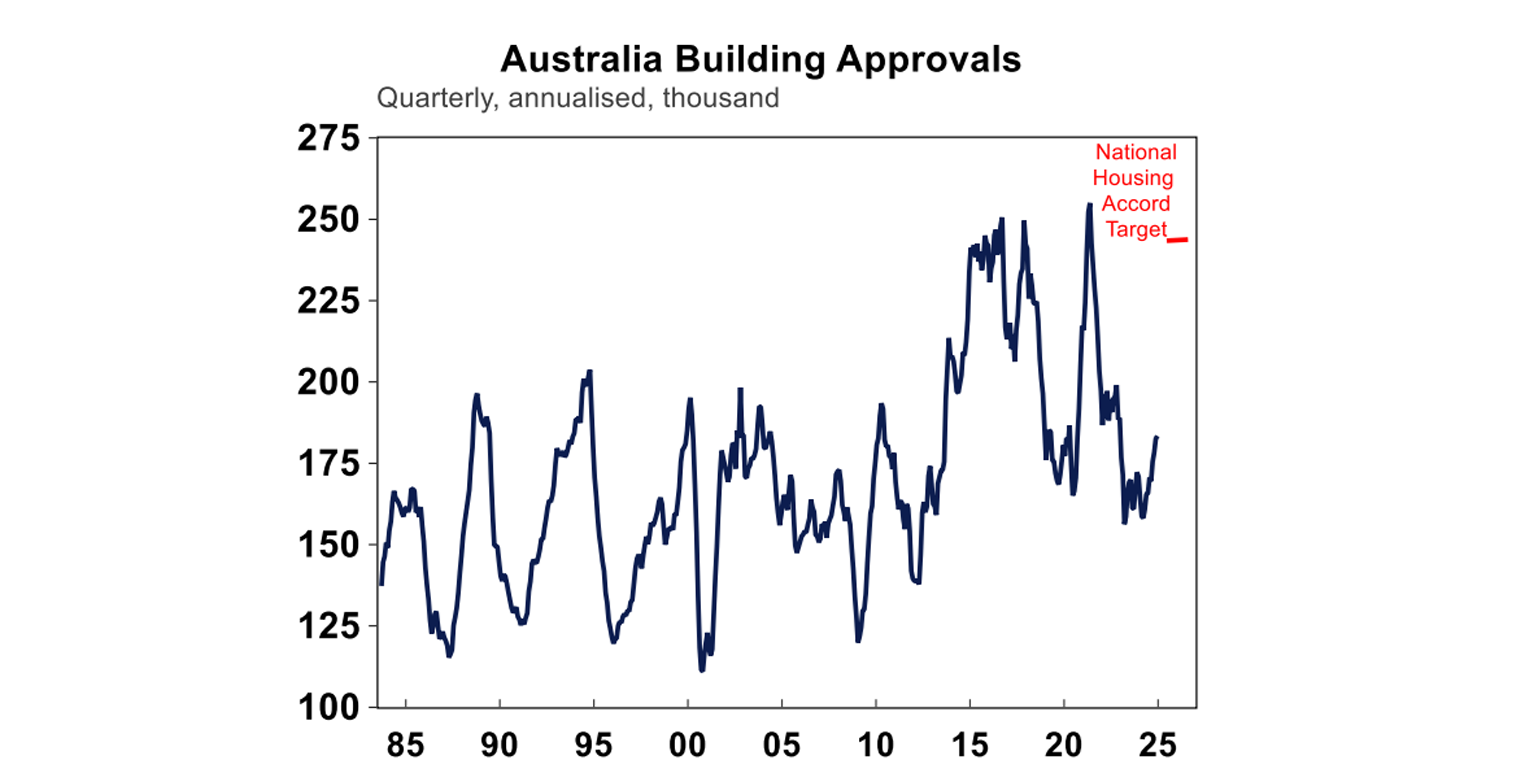
Source: Macrobond, AMP
The December trade balance declined to $5.1bn, from $6.8bn last month as strong export growth (+5.9% over the month) outweighed a 1.1% rise in imports. The trade balance remains in surplus and is much stronger compared to pre-pandemic levels (see the chart below), with ongoing high commodity prices in key commodity exports a big factor behind this change.
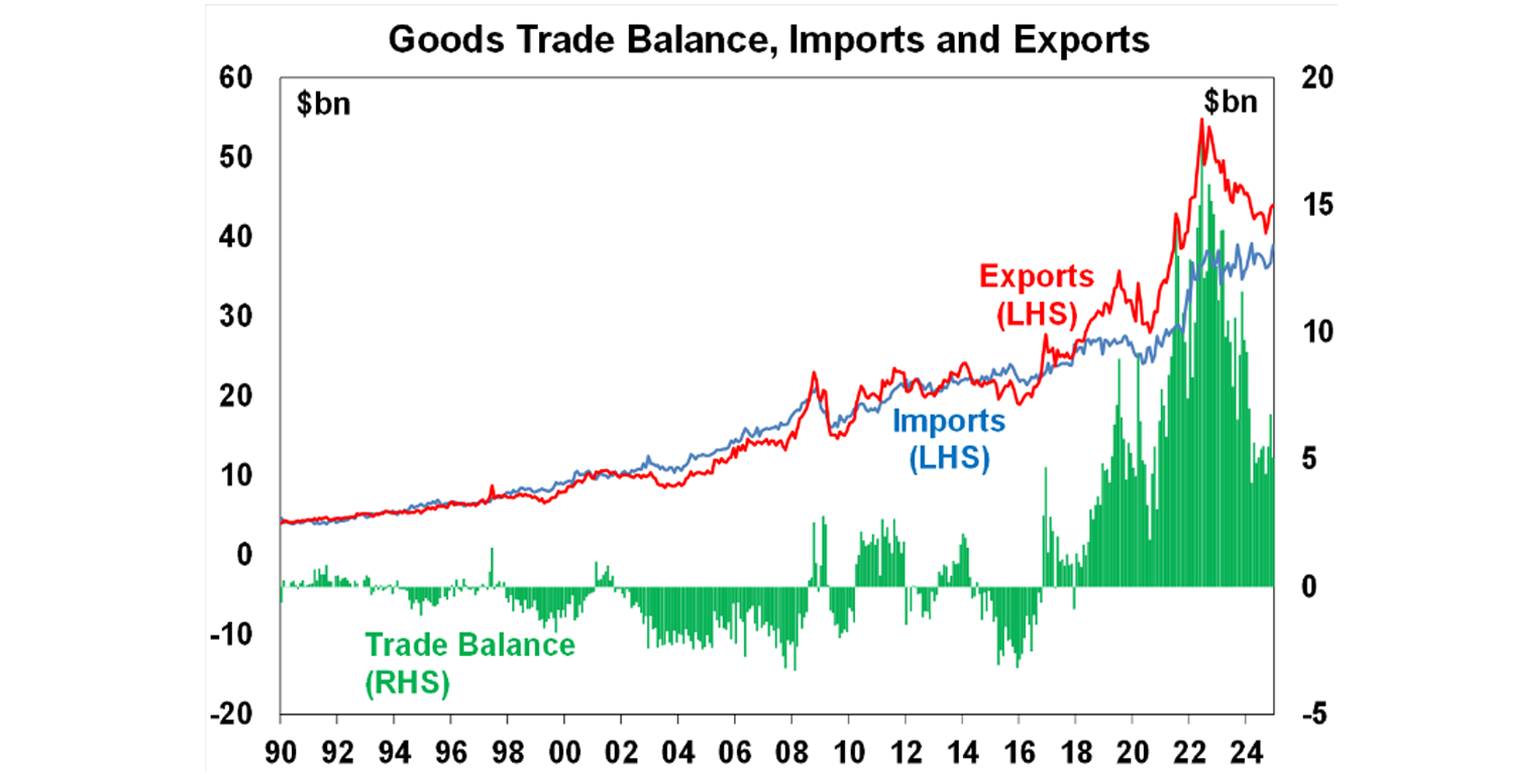
Source: Bloomberg, AMP
Australia half-year (to February) reporting season has begun with 14% of companies now reported results. Analysts have been downgrading profit expectations in the lead up to reporting season, and expect basically flat profit growth in FY25, with a lot of the downside from the resource sector. But, the outlook statements from companies should show that better conditions are likely as the environment for consumer improves from lower inflation, the 2024 tax cuts and the high probability of near-term rate cuts.
What to watch over the next week?
Next week January US CPI figures should show a moderate monthly increase of 0.3% or 2.9% over the year for consumer prices and 3.1% for the core reading. US earnings also continues and there are some Federal Reserve speeches.
Tonight US non-farm payrolls are expected to show a moderate rise in jobs ~170K, with the unemployment rate unchanged at 4.1% and average hourly earnings slowing to 3.8% over the year. Economists are also looking for historical jobs growth to be revised down noticeably which is due to population benchmarking but may create headlines about jobs growth being weaker than initially assumed.
The University of Michigan consumer sentiment reading on sentiment and inflation expectations is also released. Next week January US CPI figures should show a moderate monthly increase of 0.3% or 2.9% over the year for consumer prices and 3.1% for the core reading. US earnings also continues and there are some Federal Reserve speeches.
Tonight in Canada there is January employment data which should show a moderate in jobs growth and the unemployment rising slightly to 6.8%, the highest level since 2017 (outside of the pandemic).
Australian data includes the February Westpac/Melbourne Institute consumer confidence reading which is likely to remain subdued and below 100 (indicating negative confidence) until the RBA cuts rates. NAB business confidence is also released, and has been on the softer side recently. December quarter lending data is also out. Earnings season continues with earnings releases including some of the banks and insurance companies.
In other countries, there is little top-tier data.
Outlook for investment markets
After the double digit returns of 2023 and 2024, global and Australian shares are expected to return a far more constrained 7% in the year ahead. Stretched valuations, the ongoing risk of recession, the risk of a global trade war and ongoing geopolitical issues will likely make for a volatile ride with a 15% plus correction somewhere along the way highly likely. But central banks still cutting rates with the RBA joining in, prospects for stronger growth later in the year supporting profits, and Trump’s policies ultimately supporting US shares, should still mean okay investment returns.
Bonds are likely to provide returns around running yield or a bit more, as inflation slows to target, and central banks cut rates.
Unlisted commercial property returns are likely to start to improve in 2025 as office prices have already had sharp falls in response to the lagged impact of high bond yields and working from home.
Australian home prices are likely to see further near-term softness as high interest rates constrain demand. Lower rates should help from mid-year, and we see home prices rising around 3% in 2025.
Cash and bank deposits are expected to provide returns of around 4%, but they are likely to slow as the cash rate falls.
The $A is likely to be buffeted between changing perceptions as to how much the Fed will cut relative to the RBA, the negative impact of US tariffs and a potential global trade war and the potential positive of more decisive stimulus in China. This could leave it stuck between $US0.60 and $US0.70, but with the risk skewed to the downside if Trump acts more decisively on tariffs.
Source: AMP ‘Weekly Market Update’