Disclaimer
Information provided on this website is general in nature and does not constitute financial advice. Every effort has been made to ensure that the information provided is accurate. Individuals must not rely on this information to make a financial or investment decision. Before making any decision, we recommend you consult a financial adviser to take into account your particular investment objectives, financial situation and individual needs.
Weekly Market Update – 3rd March 2023

Investment markets and key developments
- Global share markets rose over the last week with hopes that interest rates won’t rise any more than already priced in. For the week US shares rose 1.9% with a solid rebound from technical support levels, Eurozone shares rose 2.4% and Japanese and Chinese shares both rose 1.7%. Despite the positive global lead, the Australian share market fell 0.3% with gains in resources stocks more than offset by losses in other sectors, particularly financials and property stocks. Bond yields rose further with the US 10-year bond yield briefly rising above 4%. Oil, metal and iron ore prices all rose as did the $A with the $US down for the week.
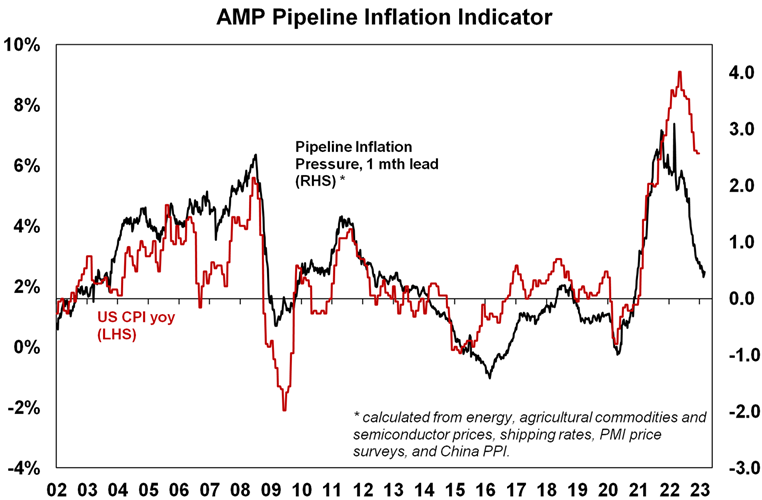
- Global inflation and the risk of more rate hikes triggering a recession remains the main concern for investment markets. The good news is that our US Pipeline Inflation Indicator, despite rising slightly in the last week, continues to point to a further fall in inflation reflecting improved supply, lower freight costs & the downtrend in business surveys regarding costs & prices.
Source: Bloomberg, AMP
- Maybe Australia is different, justifying relatively lower interest rates after all. RBA commentary over the last month has been very hawkish, and particularly so were its comments in its last board meeting minutes implying that the lower cash rate in Australia (now 3.35%) compared to comparable countries (with a range of 4% to 4.75% in the UK, Canada, the US and NZ) may not be justified with little evidence to suggest monetary policy is more potent in Australia. Our view has been that monetary policy is more potent in Australia – due to high debt ratios and a high reliance on short term mortgage rates. The run of recent data since the last RBA meeting supports this with: weak jobs data; a plunge in consumer confidence back to recessionary lows; slower than expected wages growth; stagnant nominal retail sales since September (and falling retail sales in real terms); weaker than expected underlying December quarter GDP growth (absent net exports it would have gone backwards); and weaker than expected inflation in January. This is all against the backdrop of an ongoing plunge in building approvals and housing finance. Economic data can run hot and cold and seasonal adjustment issues may be playing a role but taken together the run of recent data suggests that demand is cooling and inflation has peaked. As such we remain concerned that the RBA over-reacted to the December quarter CPI release in adopting a very hawkish stance over the last month. Our view is that the RBA has likely already done enough to cool growth and inflation and so should pause to allow more time for lags to work particularly given the run of soft recent data. However, the extent of the RBA’s recent hawkishness – flagging that “further increases in interest are likely to be needed” – means that recent data is unlikely to have been enough to prevent it hiking again on Tuesday so we are expecting another 0.25% hike taking the cash rate to 3.6%. Nevertheless, the run of softer data is a bit hard to ignore and we expect that the RBA will ease its tightening bias a bit, perhaps softening its rate guidance from “further increases in interest rates are likely” to something like the somewhat less hawkish wording it used in December that it “expects to increase interest rates further”.
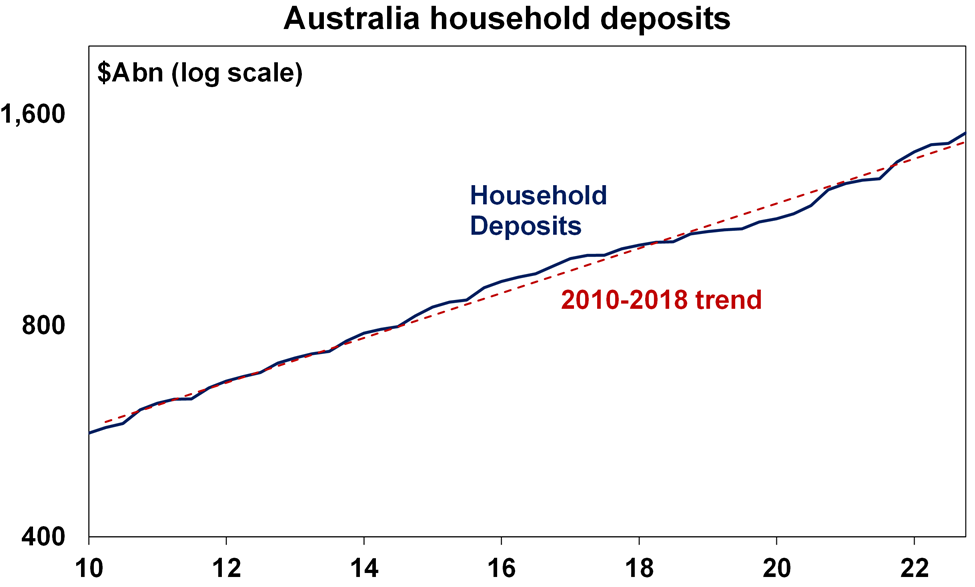
- Is the talk about big household saving buffers in Australia built up through the pandemic supporting consumer spending over done? These are thought to be around $250bn and are bigger relative to household income in Australia compared to many other economies and they are often cited as a reason for uncertainty about the outlook for consumer spending as they could support higher than expected consumer spending as the buffers are spent offsetting the drag from rate hikes. However, there are numerous complications with this. First, their estimation is very rough being the gap between actual savings through the pandemic compared to what it normally might have been – but the estimate of saving is messy as it’s just the residual from income after consumption and not actual measured savings. Second, the savings buffer is not really evident in bank deposits which are running in line with their long-term trend (or just $44bn above it – see the next chart) – suggesting any excess saving is not intended for future spending but may have been used to reduce debt or invest including via superannuation (although there is not much evidence of the latter).
Source: RBA, AMP
- And finally, while the excess savings may make life easier for households that used them to pay down debt, they appear to be substantially skewed towards older higher income people who may not adjust their spending much anyway whereas for younger newer entrants to the property market buffers are likely to be far less significant or non-existent. For these reasons its dangerous to rely on the so-called buffers as a significant source of upside support for consumer spending in Australia.
- More changes to superannuation taxes with the Government moving to double the tax rate from 15% to 30% for earnings on balances above $3 million from 2025-26. The good news is that: the changes are less onerous than the flagged $3m cap on super; those affected can still benefit from the lower tax rate on earnings from the portion of super below $3m; most would probably agree that a $3m balance is beyond what is necessary to fund a comfortable retirement; most are not affected by the change; and it doesn’t start till after the next election so may not happen. The bad news is that: its yet another wind back of super concessions and this can adversely affect confidence in super even though it remains highly tax preferred as some will worry they will be next; while only an estimated 80,000 people will be impacted the $3m won’t be indexed so more will be impacted in the years ahead (with one estimate suggesting it may impact 10% of workers by retirement in 30 years); the 30% tax will apply to unrealised capital gains which may discourage investing in growth assets and potentially lead to anomalies (eg if the share market rallies then falls just before someone retires) and may make it sensible to take the money above $3m out of super anyway (if release conditions are met) and put it in assets which are not taxed on unrealised capital gains and where the capital gains tax discount may actually mean a lower tax rate; and it only raises $2bn pa which begs the question whether there will be more tax measures given the Budget projected a $50bn deficit for 2025-26.
Coronavirus update
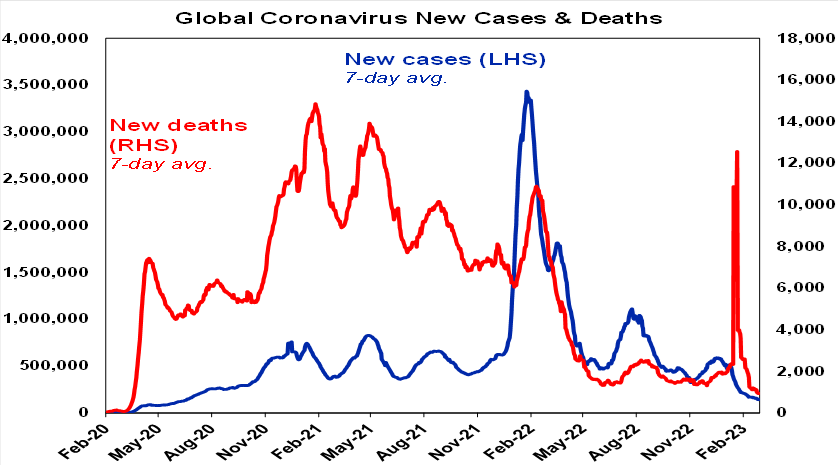
- New global Covid cases and deaths continue to fall.
Source: ourworldindata.com, AMP
- New cases and hospitalisations have stopped falling in Australia.

Source: covidlive.com, AMP
Economic activity trackers
- Our Economic Activity Trackers fell in the US and Australia over the last week but rose in Europe which continues to hold up well. They are still not indicating economic collapse.
![]()
Levels are not really comparable across countries. Based on weekly data for eg job ads, restaurant bookings, confidence, credit & debit card transactions and hotel bookings. Source: AMP
Major global economic events and implications
- US data was mostly soft over the past week. The manufacturing ISM for February rose slightly but remains weak at 47.7, underlying capital goods orders rose but have been trending sideways since late last year, consumer confidence fell, construction fell and while pending home sales rose, house prices fell and a fall back in mortgage applications on the back of rising mortgage rates points to ongoing housing weakness ahead. However, the services ISM index remained strong at 55.1. And jobs indicators remain strong with jobless claims remaining low and consumers seeing jobs as easy to get – but the labour market is a lagging indicator. The prices paid components of the ISM indexes were mixed with manufacturing up and services down although both are well below their highs and backlogs and delivery times generally remain low.
- Higher than expected Eurozone inflation. CPI inflation fell less than expected to 8.5%yoy in February with core inflation rising to a new cycle high of 5.6%yoy. This will keep the ECB hiking and hawkish for now. Eurozone economic confidence was basically unchanged in February after a rise in previous months and is running around average levels. Unemployment was flat at 6.7% in January, albeit December was revised up from 6.6%.
- Japanese economic data was mixed with a sharp fall in industrial production but retail sales up & jobs data remaining strong. Tokyo CPI inflation fell back to 3.4%yoy (from 4.4%) reflecting energy bill subsidies. Core inflation rose slightly but remains just 1.8%yoy.
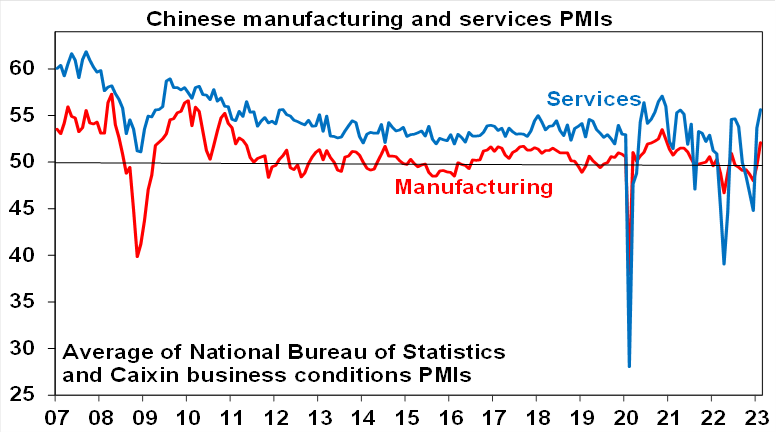
- China’s economy continuing to bounce back. Chinese business conditions PMIs rebounded further in February reflecting the boost from reopening. Chinese high frequency weekly data for, eg, traffic and subway usage, flights and property transactions, are all tracking around/above normal after well below late last year. Chinese growth this year is expected to be 6% after 3% last year.
Source: Bloomberg, AMP
Australian economic events and implications
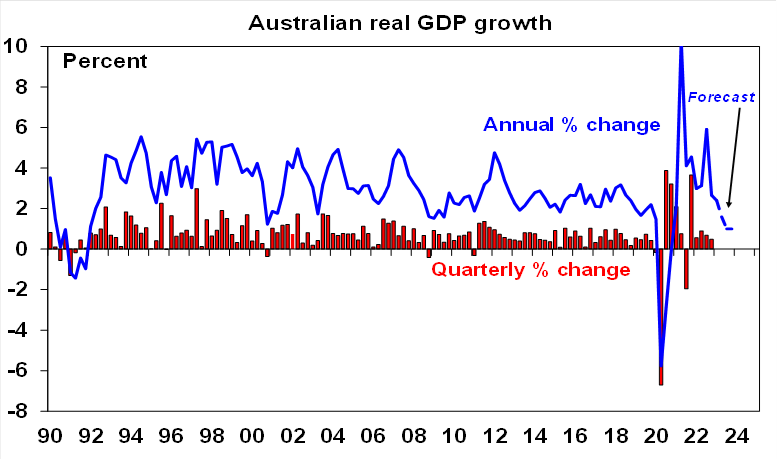
- Australian data over the last week was soft as higher rates and cost of living pressures start to impact. December quarter GDP came in weaker than expected at 0.5%qoq and 2.7%yoy with consumer spending slowing to a crawl and housing and business investment falling. Were it not for a 1.1 percentage point contribution from trade the economy would have gone backwards. We expect a further slowdown in growth this year likely resulting in a per capita recession with a significant risk of a real recession.
Source: ABS, AMP
- Retail sales are weakening. While they bounced back by 1.9% in January and are still around 17% above their long term trend, the rebound did not offset the 4% fall seen in December, cutting through all the seasonal distortions over Christmas/New Year nominal retail sales have been flat since September which means they are falling in real terms and are flat over the last year in real terms. Corporate anecdotes also suggest they are softening.
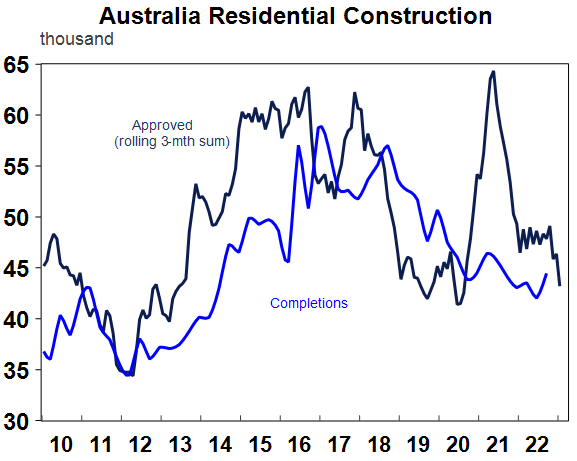
- Housing related indicators are weak with building approvals down sharply in January, housing finance plunging another 5.3% and housing credit growth continuing to slow. A catchup in completions (after delays due to rain, costs & labour shortages) to the pandemic surge in approvals will provide some support to housing construction but the downtrend in approvals is still a negative.
Source: Macrobond, AMP
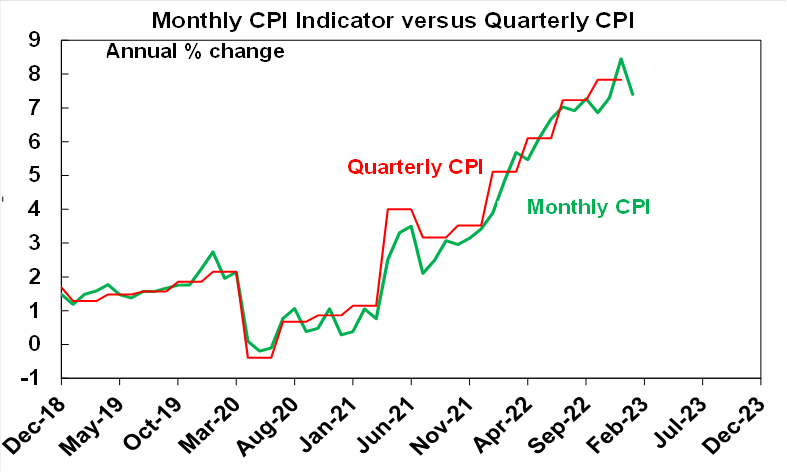
- The ABS’ January CPI Indicator slowed more than expected to 7.4%yoy, from 8.4%yoy. This monthly indicator is very volatile and so is a poor guide to the quarterly CPI but it suggests that we may have seen the peak in inflation with the December spike looking like a bit of an aberration. Rent inflation is continuing to accelerate but there are signs of slowing price gains in holiday travel, new dwelling, garments, food, furnishings and fuel.
Source: ABS, AMP
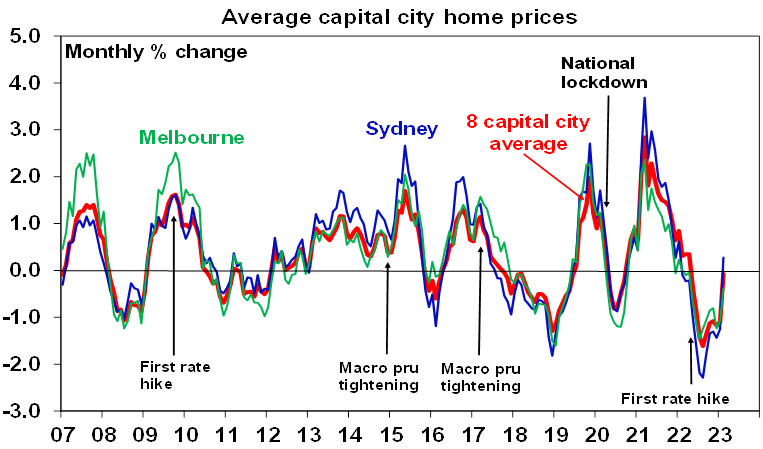
- Home price stabilisation looks like a false dawn. CoreLogic data for February confirmed a sharp slowing in home price falls to just -0.1%, with Sydney prices actually up 0.3%. Its possible that prices have bottomed after a 9% fall and we are now entering a new upswing given the return of immigration and the tight rental market. And the Australian housing markets does have a tendency to surprise on the upside. However, I remain sceptical and think the stabilisation in February reflects the return of bargain hunters after sharp falls last year along with low listings and optimism coming into the new year that interest rates were close to peaking. But – with the RBA signalling several more hikes to go (we are assuming one more hike but many economists are now forecasting three more), the capacity to borrow and pay for homes being well down from year ago levels and the combination of the fixed rate mortgage cliff which will see 880,000 mortgages face more than a doubling in their interest bill this year and the increasing risk of recession with much higher unemployment – we continue to see more weakness ahead resulting in a top to bottom fall for national average home prices of 15-20%. Its worth noting that the 2010-12 and 2017-19 price fall cycles saw periods where falls moderated or partially reversed only to resume falling.
Source: CoreLogic, AMP
- Soft profit results. The Australian December half earnings reporting season is wrapped up. The good news is that 55% of companies reported increased earnings on a year ago and 53% reported increased dividends, which are an improvement on the August reporting season. However, both were below average, comparisons to December half 2021 are relatively easy given the lockdowns at the time and there have been more companies surprising on the downside (38%) than the upside (37%). Reflecting this only 46% of companies saw their share price outperform the market on the day they released their profits which is down on the norm of 54%. Key themes are that: the consumer appears to be slowing; labour market tightness persists but supply delays are easing; bank earnings are showing signs of having peaked with credit growth slowing, interest margins likely to deteriorate and bad debts likely to rise; and big miners’ dividends have peaked for now. As a result, consensus earnings expectations for this financial year have been revised down from 7.7% to 6.6%.

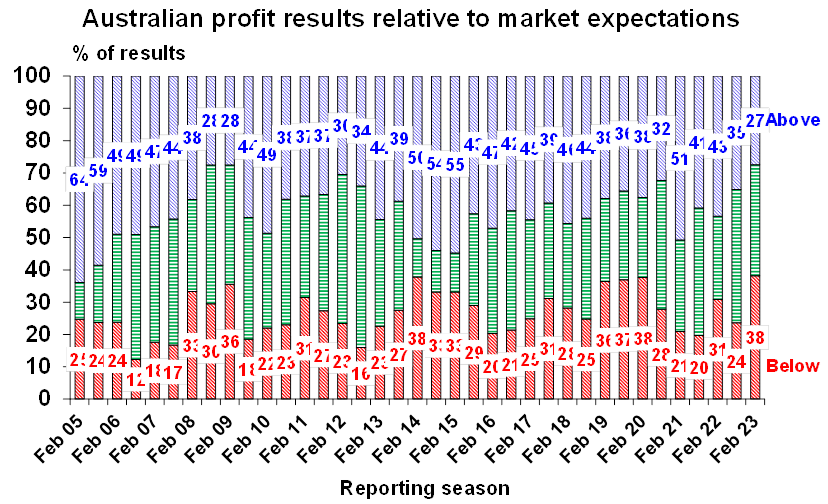
Source: AMP
What to watch over the next week?
- In the US, February jobs data (Friday) is likely to show a sharp softening with payroll growth likely to slow to around 215,000 (down from January’s blow out 517,000 gain) and unemployment rising to 3.5%. Average wages growth is likely to rise to around 4.8%yoy. January data on job openings will be released Wednesday. Fed Chair Powell will testify in Congress on Tuesday and Wednesday and will likely remain hawkish.
- The Bank of Canada (Thursday) is likely to leave interest rates on hold at 4.5% consistent with its forward guidance.
- The Bank of Japan (Friday) will probably leave monetary policy on hold but a surprise reduction in stimulus (in relation to its yield curve control) is always possible as it is Haruhiko Kuroda’s last meeting as Governor.
- Chinese February trade data will be released Tuesday and CPI inflation (Thursday) is likely to remain around 2.1%yoy with core inflation remaining low at around 1%yoy.
- In Australia, the RBA (Tuesday) is expected to raise the cash rate by another 0.25% taking it to 3.6% its highest since May 2012, making it the tenth rate hike in a row totalling 350 basis points. As noted earlier, our view is that the RBA has likely already done enough to cool growth and inflation and so should pause to allow more time for lags to work, particularly in view of the run of softer economic data lately. However, the extent of its hawkishness over the last month – flagging that “further increases in interest rates are likely to be needed” – means that recent data is unlikely to have been enough to prevent it hiking again on Tuesday and so we expect that it will raise rates by another 0.25%. However, following the run of softer economic data we expect that the RBA may ease its tightening bias a bit. After a likely hike on Tuesday our base case is for the RBA to hold rates for an extended period as economic data weakens ahead of rate cuts either later this year or early next. A speech by Governor Lowe on Wednesday will no doubt reiterate the RBA’s current views.
- A 0.25% rise in the cash rate on Tuesday, if passed on to mortgage holders as we expect, will add another $95 to the monthly payment on a $600,000 mortgage which will take the total increase in monthly payments since April to $1,200 a month or nearly $14,500 a year. This may be a bit lower over the period since April if the borrower has secured a lower rate increase.
- On the data front in Australia, the Melbourne Institute’s Inflation Gauge for February will be released Monday and the trade surplus for January (Tuesday) is likely to be around $11.5bn.
Outlook for investment markets
- 2023 is likely to see easing inflation pressures, central banks moving to get off the brakes and economic growth weakening but stronger than feared. This along with improved valuations should make for better returns in 2023. But there are likely to be bumps on the way – particularly regarding interest rates, recession risks, geopolitical risks and raising the US debt ceiling around mid-year.
- Global shares are expected to return around 7%. The post mid-term election year normally results in above average gains in US shares, but US shares are likely to remain a relative underperformer compared to non-US shares reflecting still higher price to earnings multiples versus the non-US shares. The $US is also likely to weaken which should benefit emerging and Asian shares.
- Australian shares are likely to outperform again, helped by stronger economic growth than in other developed countries and ultimately stronger growth in China supporting commodity prices and as investors continue to like the grossed-up dividend yield of around 5.5%. Expect the ASX 200 to end 2023 at around 7,600.
- Bonds are likely to provide returns a bit above running yields, as inflation slows and central banks become less hawkish.
- Unlisted commercial property and infrastructure are expected to see slower returns, reflecting the lagged impact of weaker share markets and last year’s rise in bond yields (on valuations).
- Australian home prices are likely to fall another 8% or so as rate hikes continue to impact, resulting in a top to bottom fall of 15-20%, but with prices expected to bottom around the September quarter, ahead of gains late in the year as the RBA moves toward rate cuts.
- Cash and bank deposits are expected to provide returns of around 3.25%, reflecting the back up in interest rates through 2022.
- A rising trend in the $A is likely over the next 12 months, reflecting a downtrend in the overvalued $US, the Fed moving to cut rates and solid commodity prices helped by stronger Chinese growth.
Source: AMP ‘Weekly Market Update’
