Disclaimer
Information provided on this website is general in nature and does not constitute financial advice. Every effort has been made to ensure that the information provided is accurate. Individuals must not rely on this information to make a financial or investment decision. Before making any decision, we recommend you consult a financial adviser to take into account your particular investment objectives, financial situation and individual needs.
A FinSec View – The Budget, Markets, Aged Pension & More…

|
31st May 2024 |
|
Australian Federal Budgets Economist Chris Richardson, writing in the AFR, confessed to being particularly grumpy about Jim Chalmer’s Budget claiming it is rich in politics, and poor on policy. The Government expects its cost-of-living package ($3.5bn worth of energy relief for all households and SMEs, a boost to Commonwealth Rent Assistance and the freezing of the maximum co-payment on the Pharmaceuticals Benefits Scheme) to put downward pressure on inflation this calendar year. The Treasurer is promising an inflation decline of 0.75%; the unsaid expectation is this will lead to a rate cut early in 2025 before the Government takes us to a Federal Election in Q2. We will have to wait and see if it actually plays out this way. Chris states the cost-of-living crisis is stifling Australia. Wages haven’t kept up with prices, interest costs have soared, and so have taxes. It’s caused the largest fall in living standards in more than half a century and driving a firm wedge between the haves and the have-nots, a gap that is unlikely to be restored in our lifetimes. The cause of the cost-of-living problem is multi-facetted but each facet leads to inflation in one way or another. Productivity issues which we have previously written about have kept wages down whilst inflation has triggered the Reserve Bank’s succession of mortgage rate rises. The Government was not expected to front-load the economy with new stimulus, but that appears to be exactly what it’s done. They’re relying on energy bill relief and rent assistance to reduce inflationary pressures, which statistically it may do in the short term, but the counterargument is that this will allow more spending by people, leading to more inflation down the road, which might not be seen until after the election. New spending by the state and federal governments – especially to stimulate housing and construction – almost matches the dollars in the coming tax cut. The 2023-24 surplus has increased to $9.3bn but is expected to decline to a deficit of $28.3bn in 2024-25, driven primarily by the Stage 3 tax cuts. The IMF has reiterated that if inflation is the enemy they suggest the government should respond by cutting spending and raising taxes. Instead, we’re getting a very big tax cut and almost matching that with large increases in spending. The latter is however, largely directed towards the need to resolve the housing crisis facing Australia. Instead, Chalmers is trying to subsidise our way out of inflation. Rent assistance and other measures to support the most disadvantaged at this time is what governments should be doing. But claiming it will be the answer to high inflation is a long bow. Key Budget measures include:
The budget is always a mixed bag and as usual it depends on your personal circumstances as to whether you emerged a winner or loser. The positives were largely telegraphed in advance and the negatives were in the detail. In many regards it was a budget we should have expected in the lead into an election. On the economic front, at the last meeting, the RBA kept its policy rate unchanged at 4.35% for the third straight time. With macro data being in line with the RBA’s forecast and monetary policy clearly gaining traction on the economy, the Board’s statement moved away from a hiking bias to a more balanced tone. The stronger Q1 inflation and unemployment data should lead to revisions to the June 2024 forecast and somewhat smaller changes to the year-end outlook (higher inflation, lower unemployment). However, even by December the tweaks are likely to be minor as the inflation report beat reflected some categories with potential seasonal spikes and other strong categories such as rent may see downward pressure as migration rates begin to slow. The lower-than-expected unemployment rate comes as job growth has shifted from full-time to part-time, with hours growth a muted 1.1% y/y in Q1. A range of indicators show a labour market that is still relatively tight but has loosened relative to its pre-pandemic high. Given this backdrop, the balance of risks suggests that the Board’s statement is likely to revert to a less sanguine view of inflation momentum, particularly highlighting the limited progress on services inflation. A hawkish outcome would be the re-introduction of the phrase “a further increase in interest rates cannot be ruled out”. All in all, this has led the market to begin contemplating hikes again and push out the timing of the start of the RBA’s cutting cycle. Indeed, traders in futures markets have now priced out the probability of a rate cut in 2024 and a cut beginning after that. Nevertheless, we think the weak economic backdrop and continued tightening from mortgage renewals should keep the RBA cautious. The road may be bumpy, but the RBA should retain confidence that its policy is sufficiently restrictive, though it may just take a little longer. |
|
|

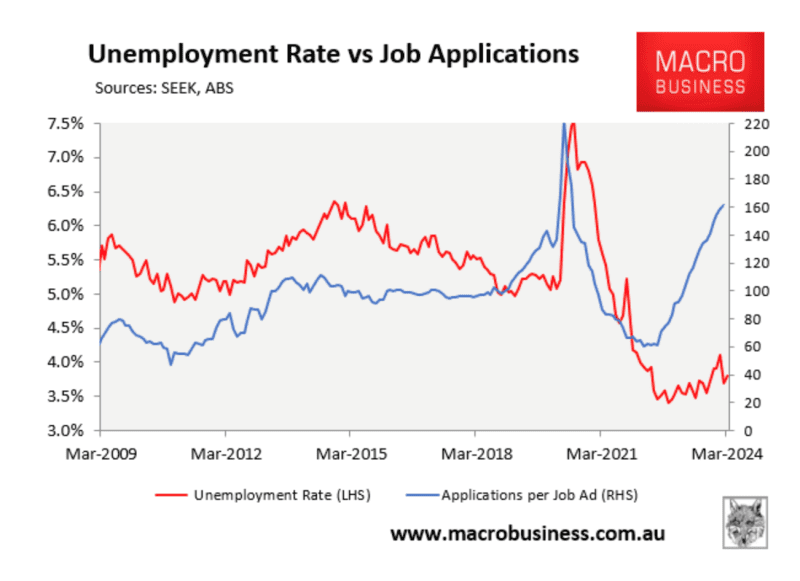
It’s not that we’re fixated on unemployment here at The View, it’s just that we’re sceptical of the state of Australia’s workforce based on how the ABS dices the data. Historically, when the economy is slowing, which it is, unemployment starts to rise sharply, but it is not. Firstly, Australia’s unemployment rate rose marginally to 4.1 per cent in April, up 0.2 percentage points from March. The number of people counted as officially unemployed increased by 30,300 last month, while the number of employed people increased by 38,500. With employment and unemployment both rising, the participation rate rose by 0.1 percentage points, to 66.7 per cent, which is relatively high if you accept the traditional view. Bureau of Statistics data show the employment-to-population ratio remained steady at 64 per cent, indicating that recent employment growth is broadly keeping pace with population growth. Hours worked remained unchanged last month, despite the steady 38,500 increase in employment. That’s because more people took leave around Easter than they did last year, with work patterns aligning more broadly to pre-COVID times. Now for the interesting bit. MB Fund/Super chief strategist David Llewellyn-Smith, who writes on macroeconomics.com.au, is questioning the veracity of the ABS unemployment data which is used by Treasury and the Government for policy and the Reserve Bank to determine the state of economy, inflation and interest rates. That’s not new, many economists and statisticians have questioned the data for decades. Llewellyn-Smith’s argument is partly evidenced by the number of job ads in March 2024, which rose by 0.2%, or 400, to 249,000. That’s almost half as many job ads in the market as there were for March 2019, he says. He points out that each of the past three times that job ads were at the current level (in 2007, 2009, and 2021), the unemployment rate was at 5%. But there was a smaller pool of workers in those years (e.g. there were three million less workers in 2008) compared to today. So, doesn’t the same amount of job ads but more workers equate to much higher, not lower, unemployment? Like many economists and financial strategists, he has two longstanding criticisms with the ABS’ unemployment data to explain his thinking. Firstly, underemployment in Australia is a much bigger issue than unemployment, which is measured by working for one solitary hour a week. Secondly, the ABS, he says, is struggling to adapt to superfast immigration. If 60,000 workers arrive every month, the ABS cannot capture the expansion of the available labour pool. Llewellyn-Smith says every 60,000 workers is worth 0.42% in unemployment if they are idle. Economists in the UK have the same view about their unemployment data. The Financial Times recently wrote: “Swings in immigration, rapid changes to working conditions in the wake of the pandemic and lower participation in polls are combining to create a big problem for labour market statisticians. Economists are increasingly questioning whether official reports can be relied upon for an accurate read of the labour market.” Llewellyn-Smith says the data he is crunching suggests a material rise in unemployment is already well underway, with skyrocketing job applications. We do wonder how long it will be before the ABS catches up. Will we find ourselves in a Recession? Per capita GDP is down 3 quarters in a row with only immigration holding up actual GDP. Unemployment is the contradiction, or is it? Our sense is that the economy isn’t tracking as well as the top line numbers suggest. As the graph below suggests, at some stage in the next few months the divergence in the data will normalise with one of the lines changing direction, it will be interesting to see which one!
|
|
|

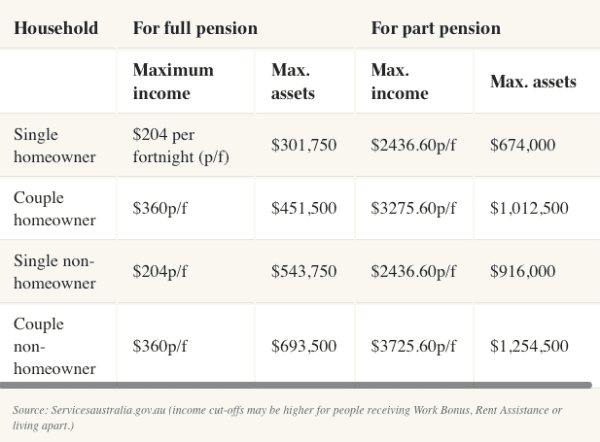
If you’re approaching or thinking about retirement and still don’t understand Australia’s age pension eligibility rules, then you’re not alone. Apparently, three out of five Australians in the twilight of their working lives don’t know or understand age pension rules. Given the often-confusing nature of media commentary around retirement, it’s no wonder. Recent research by Colonial First State found just 38 per cent of Australians aged 50 to 64 understand their age pension eligibility, and only 37 per cent understand how to access the pension. What surprises most people is you can have substantial income or assets and still receive a part-age pension. For example, a couple retiring today can have more than $1 million in assets plus their principal home and still receive some Centrelink aged pension. The system is complex and can be hard to navigate as eligibility and amounts are calculated based on individual circumstances and takes into account both income and assets. This also varies if you are being assessed as a single person or a couple. Based on the income test, a single person can have income up to approximately $63,000 per year and still receive a part-age pension, whereas a couple can have income just over $96,000 combined per year and still receive a part-age pension. Senior couples who own their own home might be surprised to learn the value of their principal home doesn’t count as an asset, when it comes to determining eligibility for aged pension. They could receive at least a part-age pension if their other assets are below $1,012,500. For couples who don’t own a principal home the cut-off is $1,254,500. Key factors determining peoples’ pension eligibility are:
Here’s the table to use as a guide*:
*The full details and requirements can be found on Services Australia’s website by searching Income test or Asset test for age pension. |
|
|
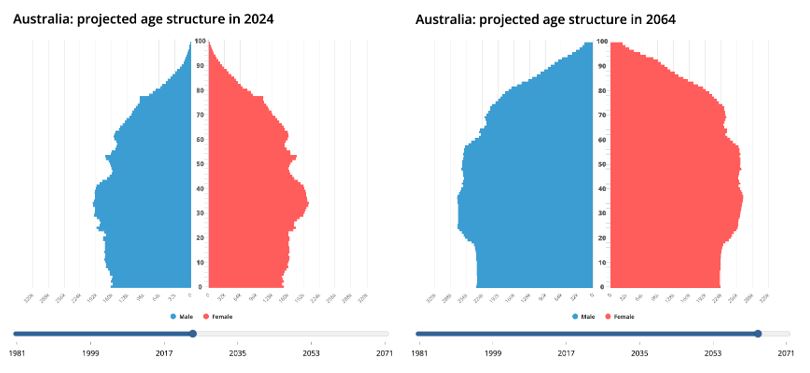
Australia is facing an interesting balancing act over the next 40 years. Australia’s unique economic puzzle: how to maintain, and even grow, its prosperity while its natural population growth slows and potentially shrinks in the coming decades. We are however, not alone, the same issue is being faced by many countries across the globe. Japan is likely to see a real population decline from 123M to 86M in this time. Other than following the black plague hundreds of years ago, we have never had to grow an economy with a shrinking population. This demographic shift presents both challenges and opportunities that demand innovative solutions from policymakers and businesses alike. Fewer workers can lead to labour shortages in crucial sectors, reduced tax revenue, and strain on social security systems. Immigration of young skilled migrants may be the only obvious solution, but if the rest of the world is suffering the same issue, then we will be competing for talent. Adding to this challenge is the burden of supporting an ageing population. As the proportion of older Australians increases, so too will the demand for healthcare services and aged care. This can further strain government budgets and resource |
|
|
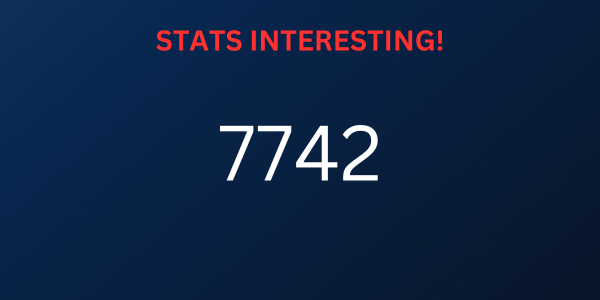
This is the number of Australian companies that have gone into administration in the nine months between July 1 last year and March 31 2024, according to ASIC’s insolvency data. With only a few weeks of this financial year left, ASIC expects the number could exceed 10,000 by June 30, a level not seen in Australia since 2012-13 financial year.* Interestingly, the ratio of registered businesses going under compared to the total number of businesses, are smaller now than a decade ago, as the number of companies registered in Australia has increased from just over 2 million to 3.3 million. Out of these external administrations, construction (2142) and accommodation and food services industries (1174) represented the greatest number of company failures, accounting for nearly 27.7% and 15.2%, respectively. Anyone living in Adelaide would be well aware of almost weekly media coverage of yet another bar, café or restaurant closing its doors, with most Putting the blame towards cost of living as the dominant cause for keeping customers away. Tim Reardon, chief economist at the Housing Industry Association, says his industry is suffering from a “bullwhip effect,” meaning pent-up pressures on builders being passed on to subcontractors. It’s a perfect storm of fast-rising material costs, worker shortages, supply chain delays, blowing out build times and the challenge of fixed-price contracts. One of the saddest casualties in the retail sector was the 93-year-old electrical goods retailer Godfrey’s which went into voluntary administration in March. Most of the insolvencies have been small to medium enterprises (SMEs) with inadequate cash flows and trading losses. They are squeezed extra hard by interest rates, cost-of-living and profit margins. A devastating side effect of entering administration is the loss of retirement security. Owners are often left with little to no personal gain after creditors are paid. The retirement savings/super they were counting on from selling their business vanish. Most SME owners in Australia tend to be older, thus find it harder to re-enter the workforce and earn enough to rebuild their retirement savings quickly. This highlights the importance of putting something away for yourself from your profits when you can because if your business is disrupted you want to have something to show for your years of work and the risk of being a business owner/entrepreneur. Relying on selling your business as a retirement plan is risky. A sale isn’t guaranteed, or it might sell for a lot less than expected; market conditions, industry fluctuations, and even personal reasons can derail a sale. Owners counting on a specific sale price for retirement can be left feeling short-changed – owners facing administration might not have the luxury of waiting for the perfect offer, forcing them to accept a lower price or lose everything. Overall, the current situation highlights the importance of a diversified retirement strategy – and succession planning – for SME owners. Relying solely on the sale of the business is a gamble, there are so many stories of industries being “disrupted” by technology, innovation or economic conditions and the consequences of losing that bet can be severe. (*2012-13 saw lingering effects from the 2008 GFC, economic growth yet to pick up and volatility in financial markets; slowdown in China our major trading partner, reducing demand for our exports; decline in commodity; stagnant wages and rising unemployment impacted consumer behaviour) |
|
|
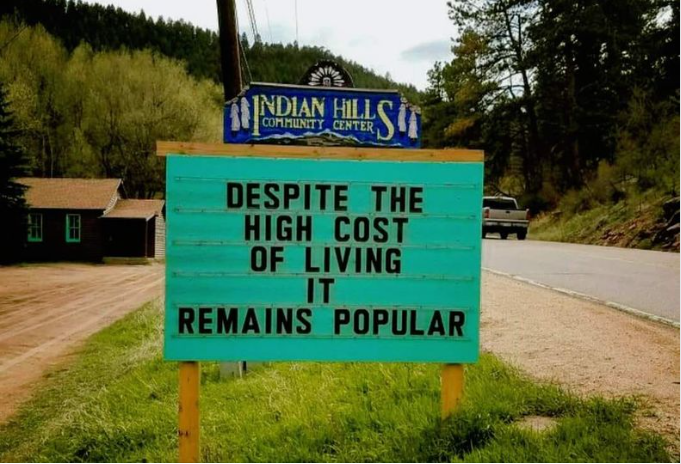
This sign says it all, really, doesn’t it? Fun fact: Apparently, the original quote was “in spite of the high cost of living, it remains popular,” and it was first attributed to Kathleen Norris (1880-1966), an American novelist and newspaper columnist who was one of the most widely read and highest-paid female writers in the United States from 1911 to 1959. The more things change…the more they stay the same! |
|

