Disclaimer

Information provided on this website is general in nature and does not constitute financial advice. Every effort has been made to ensure that the information provided is accurate. Individuals must not rely on this information to make a financial or investment decision. Before making any decision, we recommend you consult a financial adviser to take into account your particular investment objectives, financial situation and individual needs.

A FinSec View: So, recession? Everyone wants the same dollar, A windless winter and The distance tax

A Finsec View

The View – 16th October 2026

Letter from the editor: Where have all the geniuses gone?

Michelangelo was born in 1475. Suppose he’d been born in 2000 instead. At 26, would anyone hand him the block of marble that would become the David, one other sculptors had already given up on? Or would he be finishing a design degree, painting ceilings on weekends and waiting for an algorithm to notice?

Shakespeare wrote for a world of perhaps 500 million people. There are more than 8 billion of us now, on average far better educated. That’s sixteen times the people, and you’d be hard-pressed to name a second Shakespeare (though scholars would point out that even the first one had help).

One explanation is that our geniuses are simply working in different forms: writing code, designing vaccines, landing rockets. The Sistine Chapel has given way to the server farm.

A less comfortable possibility is that for everyone landing rockets, others never get the chance. Perhaps the geniuses are still here. So who’s backing them? What seems harder to find today is the patron: someone willing to back an unusual person before there’s any proof. Lorenzo de’ Medici spotted a teenage Michelangelo in his sculpture garden and took him into the household on nothing but his own eye.

Today that job often sits with institutions that can’t afford to be wrong. Keynes saw it ninety years ago: it is “better for reputation to fail conventionally than to succeed unconventionally.” Many of our backers answer to quarterly results, three-year grant cycles and the next election, and plenty of original ideas take longer than all three. Super funds are tested against a benchmark that has rightly cleared out those not earning their fees. The side effect: the safest place to stand is right next to the index. The David needed one committee’s blessing. Try counting how many a new idea needs today. Call it the permission economy.

The Australian economy shows a similar pattern. Population growth does much of the heavy lifting, and that’s no criticism of the people. Plenty of Australia’s most enterprising arrivals came with a suitcase and an idea. The catch is that a growing population lifts GDP whether or not anyone backs anything new, which makes it easy to skip the harder part. Our tax settings tend to reward the safe asset over the new idea, and, as our Chart of the Week shows, a growing share of our own savings now heads offshore. The economy keeps growing. Living standards are just not keeping up.

That caution weighs heavily on small business, where many new ideas find their first backer in the founder’s own savings. Before the first customer walks in, there’s a growing pile of licences, compliance and paperwork to clear. Federal law alone carries about 30% more restrictive terms than it did in 2003, according to CEDA. And from next July, the capital gains discount gives way to indexation, kinder to steady assets than to the small, early stake that comes good.

None of this is a law of nature. Greg Boorer put his own house on the line to co-found CDC Data Centres in 2007. Alex Vynokur arrived from Ukraine at 15 with little English and went on to build Betashares. At The Australian Financial Review’s Chanticleer lunch last month, both founders asked for something no government has offered in a while: a 30-year vision. As Boorer put it, “Australia needs to be more ambitious.”

Productivity often starts with someone backing an idea before it’s proven. We’d like to think Australia still has its Michelangelos, and the money to back them. But right now it just has a system that makes the safe bet easier than the brave one. The encouraging part: that’s a setting, not a shortage, and settings can be changed. With money expensive again (see our feature), playing it safe may cost more than it looks.

Enjoy the read.


Markets in 5 Charts | The three Ps of Australian growth

Deloitte Access Economics put it most bluntly: Australia “has mistaken a larger economy for one which is more prosperous”.

It isn’t only economists who’ve noticed. As our intro mentioned, business leaders are asking for a 30-year vision too. Canberra did publish a long-range document in September. Treasury’s Intergenerational Report projects real growth of about 2% a year over the next 40 years, down from 3% over the past four decades. It’s a forecast, not a vision. A forecast tells you where you’re heading. A vision decides whether you want to go there.

Regular readers will know the three Ps: population, participation and productivity. They’re back for good reason: between them, they decide how fast an economy can grow. It can add more people, draw more of them into work, or get more from each hour worked. Australia has leaned heavily on the first, squeezed much of what’s available from the second, and stalled on the third. The five charts below take each in turn, then what it all means for investors.

1. A bigger economy, not a richer one
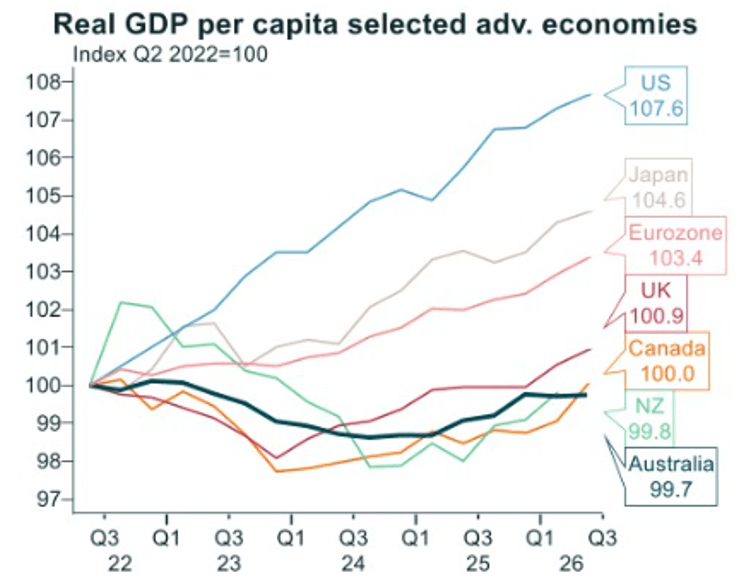
Source: IFM

Australia’s economy grew by 2.1% over the year to June. Spread across a population growing almost as quickly, that’s just 0.7% per person. Since mid-2022, real GDP per person has risen almost 8% in the United States, about 5% in Japan and 3% in the euro area. Australia’s is still a fraction below where it started. The company we keep near the bottom of that table is telling: Canada and New Zealand. Migration has made headlines in the US and Europe too, but few advanced economies have grown their populations as quickly as Australia, Canada and New Zealand. Japan managed its 5% with a shrinking population.

Change the starting line and the picture changes with it. Measured from 2019, Australia looks middle of the pack: GDP per person is up about 4%, level with France and ahead of Canada, the UK and Germany. Measured from 2022 (as per this chart), it’s last. Everything we gained per head, we gained before the borders reopened. And some of that was flattery. With the borders shut, the head count barely grew, so the same economy was shared among fewer new arrivals.

Either way, the pattern runs deeper. More than half of this century’s growth has come simply from having more people. Annual real growth has slowed from an average of 4.2% across the 1950s to 1970s, to 3.3% in the 1980s and 1990s, and 2.6% so far this century.

Population is the quickest and easiest lever to pull. A supermarket doesn’t need every customer to buy more if more customers keep walking through the door. But it makes the pie bigger without making anyone’s slice bigger, and if housing, roads and services don’t keep pace, the arithmetic looks better in the national accounts than on the morning commute.

And increasingly, those extra customers are arriving rather than being born here. Australia’s fertility rate has fallen to a record low, while net overseas migration now accounts for roughly three-quarters of population growth. Migration is not merely supporting the economy. It has become the main engine of its expansion.

Pay packets tell the same story. Wages rose 3.2% over the year to June, more slowly than prices, so real wages went backwards. Australians can be told, quite accurately, that the economy is growing, while wondering, also quite accurately, when they were meant to notice.

2. Participation: the lever with a decade left in it
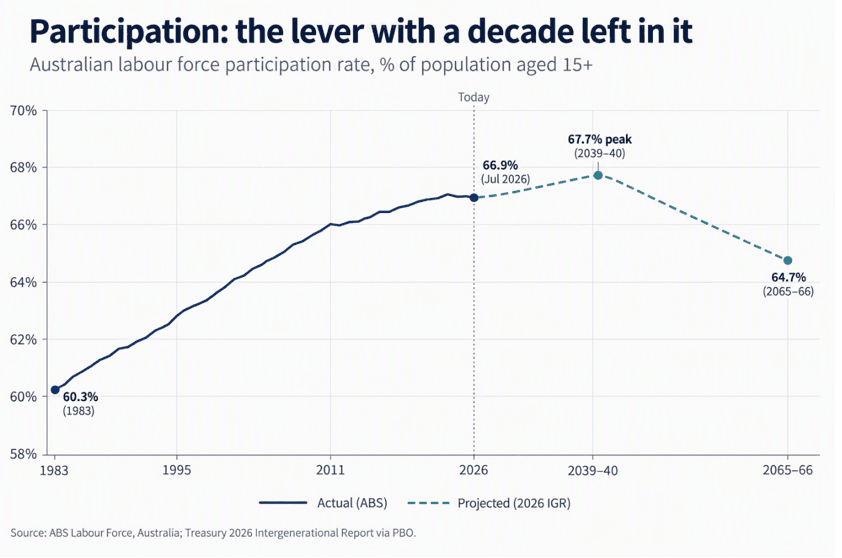
Source: ABS, Labour Force, Australia; Treasury, 2026 Intergenerational Report (via PBO)

The second P is participation: the share of Australians aged 15 and over who are working or looking for work. Australia has been remarkably good at this. The trend rate held at 66.9% in September, close to record highs, driven largely by more women and older Australians staying in work. It has also been doing a quieter job. For most of this year, unemployment rose partly because more people wanted work, not because fewer had it. September broke the pattern: employment fell by 39,300 and 31,400 people stopped looking. When people give up looking, the labour market is telling you something the unemployment rate won’t.

The catch is in the Intergenerational Report. Treasury projects participation will edge up to about 67.7% by 2039-40, then fall to 64.7% by 2065-66 as the population ages. At today’s population, that’s roughly 185,000 extra workers on the way up and nearly 700,000 fewer on the way down.

Ageing does the damage because of how the rate is measured. Everyone over 15 counts, retirees included, so every boomer who hangs up the tools pulls the number down, however hard everyone else works. And even at its best, participation adds hours, not value per hour. There are only so many Australians left to invite to the office, and the ones already there are getting older.

3. Productivity: where the jobs went
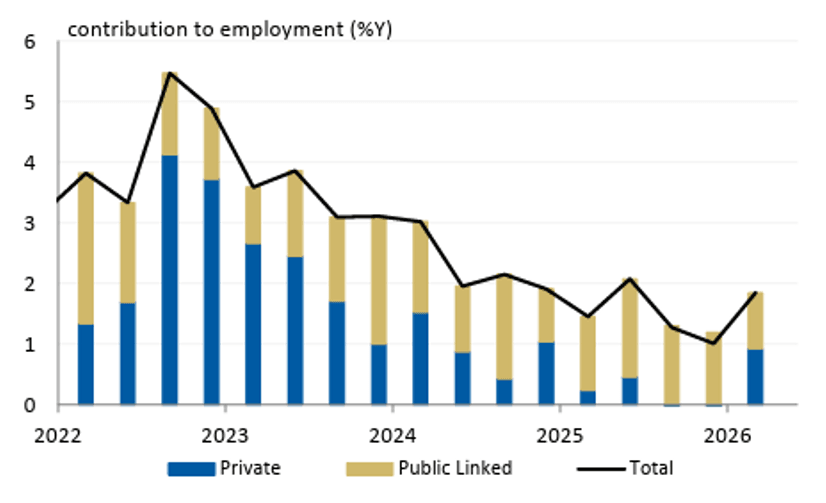
Source: Morgan Stanley (via Pinnacle)

Productivity is the one that pays the bills: how much is produced for each hour worked, and the only P that can sustainably improve GDP per person and in turn lift real wages. Over the year to June, output rose by 2.1% and hours worked rose by 2.3%, leaving productivity 0.2% lower. It is now barely 1% above its 2015-19 average.

The more revealing number is the split. Since June 2014, productivity in the market sector, the businesses that sell to customers, has risen by 7.5%. In the non-market sector, largely health, education, care and public administration, it has fallen by 2.5%. Meanwhile, much of the recent jobs growth has come from exactly that sector. The chart shows how quickly it happened: in 2022, private businesses did most of the hiring. By 2025, public-linked jobs were doing almost all of it. Health care and social assistance is now Australia’s largest industry, employing close to one in six workers, and its fastest growing. The economy has been adding jobs fastest where productivity is hardest to lift.

That’s no criticism of nurses or carers. An ageing population needs them, and output in these sectors is notoriously hard to measure, so the statistics probably understate it. But it means the national average is being pulled down by the mix of work, not a lack of effort.

Much of that sector runs on public money, and government is now bigger than it has been in a long time. Commonwealth payments are forecast at 26.8% of GDP this financial year (more on this below), a level rarely reached outside war or a pandemic, with the NDIS, aged care and health among the fastest-growing items. One figure doing the rounds, has the public-sector workforce up 25%. We couldn’t verify it exactly, so treat it as a rumour, not a statistic. The direction however, isn’t in dispute. There may be good arguments for much of that spending. But it lands in the part of the economy where the productivity numbers are weakest.

A report released this month by the Australian Institute of Company Directors estimates that red tape, compliance costs and other regulatory barriers explain around 20% of Australia’s decline in business dynamism—fewer firms starting, growing and competing.

4. The AI paradox
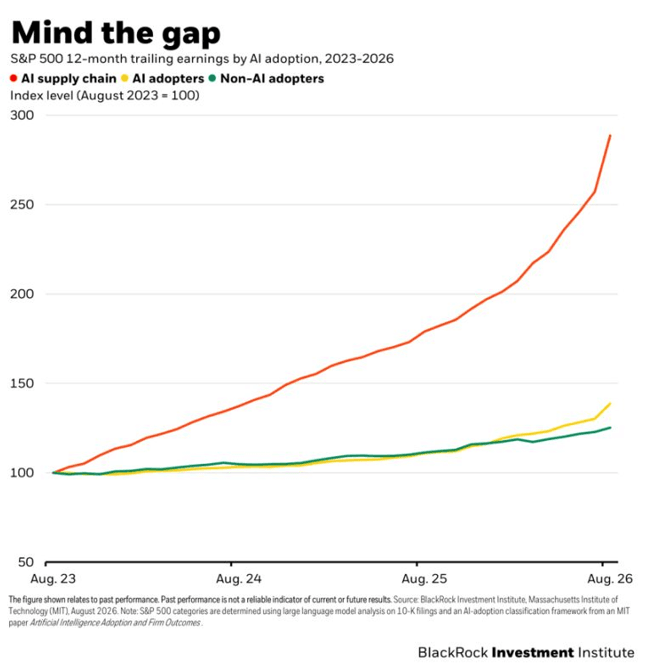
The gap is real, but look at who’s winning it. Earnings for the companies selling AI have nearly tripled since 2023. The companies merely using it are only modestly ahead of those that aren’t. Source: BlackRock Investment Institute (via Pinnacle)

If productivity is the problem, AI should deliver some answers. And it has one big advantage over the last great general-purpose technology. Electricity needed power stations, poles and wires strung across the country before a single factory could plug in. AI is already on every phone, much of it free.

So is it showing up?
In company profits, yes. It’s no secret that earnings at S&P 500 companies adopting AI are starting to pull away from those that aren’t, though many of the early winners are also the ones selling it, which flatters the gap a little.
In the national productivity figures, not yet. Mind the gap.

Why the gap? Partly because access was never the slow part. Even after the power reached the factory gate, electricity took decades to lift productivity, because the gains came only once factories were rebuilt around it. Computers ran the same course. In 1987 Robert Solow quipped that “you can see the computer age everywhere but in the productivity statistics”. The payoff arrived about a decade later, once businesses had changed how they worked. AI makes getting the tool instant. It doesn’t make changing the work any quicker. A few hundred companies doing that well can lift their own earnings long before they move a national average.

And partly because of where Australia’s problem sits. An hour saved drafting emails only counts if it’s spent producing something else. Much of our productivity drag is in health, education and care, where a chatbot can’t do the work and every new tool needs sign-off first.

Changing how work gets done takes investment, retraining and patience, and Australia isn’t setting the pace. Business spending on research and development has fallen from 1.3% of GDP in 2010 to 0.9% in 2022.

For investors, that gap is the point. The early gains from AI are flowing to the businesses that adopt it well, and for now most of them are listed overseas. Australians share in that largely through what they own offshore, including the super that has headed abroad (mmm… more in our Chart of the Week). The harder question is how long we’re content to own the gains rather than make them.

The Intergenerational Report calls AI “a defining influence on the economy over the next 40 years”. Fair enough. But here’s the bit that doesn’t make the brochure: before AI makes anything cheaper, it makes plenty of things more expensive.. Building it takes chips, data centres, power, concrete and electricians, and the whole world wants them at the same time. That’s inflationary, at least for now. And if the productivity payoff does arrive, we can argue it pushes interest rates up, not down, because a faster-growing economy has more businesses wanting to borrow and invest. Great news for living standards. Less great for anyone holding out for a 2% cash rate.

5. Markets and portfolios: a year of two speeds
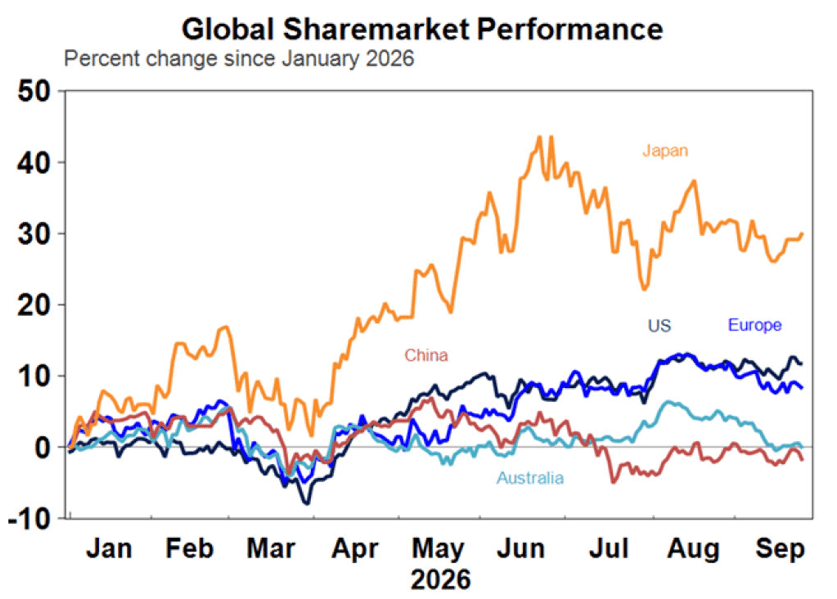
Source: Macrobond, AMP

If the economy has been running on population, markets have been running on something else entirely. Since January, Japanese shares are up around 30%, Wall Street around 12% and Europe around 8%. The ASX is roughly back where it started. Of the major markets, only China has done worse.

And Australia went nowhere the hard way. Expected rate hikes, expensive oil, rising bond yields and falling property prices all leaned on the market at once. Japan’s year was no smooth ride either. It was up more than 40% by June and has handed back about a quarter of that since. Fast doesn’t always mean steady.

The gap has a simple shape. Outside Japan, which ran on its own story, the strongest markets were the ones closest to AI: US platforms first, then the chipmakers of Korea and Taiwan. June-quarter earnings at S&P 500 companies grew more than 50% on a year earlier, the strongest result in five years, and July’s sharp sell-off in the same names was bought back within a month. Australia had little of that to sell. Our market leans on banks and miners, and the banks have been de-rating as housing credit slows and bad-debt expectations rise. No wonder the ASX has spent the year running uphill.

The other story is the price of money, which our feature takes up in full. Rising bond yields hit anything valued on distant cash flows, which is why property, normally the steady part of a portfolio, was the weak spot: Australian listed property lost 15.5% over the 12 months to August. Australian bonds returned just 0.6% over the same period, well short of cash.

What does that mean for portfolios? Four things, none of them new, all of them easier to say than to sit through.

Diversification earned its keep. Over the 12 months to August, a portfolio that stayed home made 4.4%. One spread across the world did between two and five times better, depending on the currency call, and one heavy in Australian property went backwards. Next year the order may well reverse.

Leadership is narrow. Much of the world’s gain came from a short list of AI-linked companies and two North Asian markets. For perspective, Nvidia alone is now worth almost two and a half times the entire Australian share market. When so few names carry so much, concentration is a risk worth sizing, not ignoring. Anyone holding a global index fund owns more of that bet than they might think.

Nobody’s talking about 1999. They should be. The last time the world spent this hard on a new technology was the late-1990s internet boom. Then, as now, the spending ran hot, inflation crept up, rates rose and long bond yields climbed. Then, as now, US shares got very expensive: the Shiller P/E — which compares share prices with average inflation-adjusted earnings over the previous decade — is around 41, a level beaten only at the top of the tech boom, when it reached 44 in December 1999. The internet turned out to be every bit as transformative as promised. Investors who bought the Nasdaq at the peak still waited 15 years to get back to even. AI can be right about the future and still be wrong about the price, so it is worth knowing how much of your portfolio is riding on the answer.

Currency is a decision, not an accident. The Australian dollar climbed to US$0.72 by the end of August (it has since slipped back below US$0.70), so over the 12 months to August, the same global shares returned 21.0% hedged and 10.0% unhedged. That’s 11 percentage points from a choice most investors never knowingly made.

One more, closer to home. The three Ps leave one question worth asking of any company: could it grow if its market didn’t? Businesses that rode a rising population, such as banks, supermarkets and toll roads, may find the tide going out just as money gets dearer. Those with pricing power and a knack for getting more from what they already have deserve a closer look.

It’s the same question the economy is facing, asked one company at a time.


Everyone Wants the Same Dollar

Key takeaways

  • Cheap money was the exception. From the GFC to the pandemic, the cash rate averaged 2.66%. The decade before, it averaged 5.57%. Today’s 4.6% is closer to normal than it looks.
  • Everyone wants the same dollar. AI, energy, defence and governments are all borrowing from the same pool of savings, and that pushes up the price of money.
  • It rhymes with 1999. A huge investment boom is running into rising rates. AI is real, and so was the internet. Being right about the future doesn’t mean being right about the price.
  • Recession or not, it will feel like one. Living standards are taking the hit that GDP isn’t showing. The answer is to assume money costs something and let defensive assets do a job again.

Cheap money was never the natural order of things. It was a decade when the world’s savings had few takers. That decade has ended, and the queue is long.

Between 2009 and the pandemic, Australia’s cash rate averaged 2.66%. In the decade before the GFC it averaged 5.57%. Most of us filed the first number under “normal” and the second under “history”. It may be the other way around.

On 29 September the Reserve Bank lifted the cash rate to 4.6%. It was the fourth rise this year and took the rate to its highest level in 15 years. The obvious explanation is inflation, which reached 4.0% in August. The more interesting explanation is that money now has a great many more suitors.

The queue

Economists name five claims on the world’s savings, all arriving at once: the energy transition, the infrastructure needed to run AI, remilitarisation (defence spending), de-globalisation and ageing populations leaning on government budgets. None of them is about to stop, and none of them is uniquely Australian. Every Western economy is chasing the same five things at once. And when more borrowers compete for the same pool of savings, the price of those savings goes up.

The numbers aren’t subtle. Microsoft, Alphabet, Amazon and Meta have guided to roughly US$745 billion of capital spending this year. The big tech names sold about US$159 billion of bonds in the first five months of 2026, compared with around US$28 billion a year across 2020-24. Alphabet has sold a 100-year bond, which is either supreme confidence or a very long wait for an answer. Governments are in the same queue. The Budget calls it “Commonwealth payments”; the rest of us call it government spending. Either way, it’s forecast at almost $830 billion this financial year, or 26.8% of GDP, up from around $500 billion in the last pre-COVID budget. Gross debt passed $1 trillion in August and is forecast to reach about $1.05 trillion by June 2027. The result is a Reserve Bank braking while government spending is still growing, which leaves interest rates doing most of the work on inflation. Borrowers feel it first.

Bond markets have noticed. In late September and early October the US 10-year yield hit its highest level since 2002, and Australia’s 10-year was above 5.4% by early October, near its highest level since 2011.

The price of dearer money has even reached the Reserve Bank’s own books. It lost $8.5 billion last year, taking its negative equity to $11.3 billion, largely because the pandemic-era bonds it bought lost value as yields rose. A central bank cannot go broke like an ordinary company, but the loss is real enough: it has paid no dividend to Canberra since its 2020-21 payment of $2.7 billion.

Partying like it’s 1999

Here’s the comparison hardly anyone is making. In the late 1990s the world went all in on the internet. Money poured into cables, servers and anything ending in “.com”, the economy ran hot and inflation crept up. So the Fed started lifting rates: 1.75 percentage points between June 1999 and May 2000, while the US 10-year bond yield climbed from around 4% to almost 7%. Then the boom ate itself. The S&P 500 fell 49%, the Nasdaq fell 78%, and America got a recession for dessert.

Read More

Chart of the Week

Money has become painfully expensive around the world. Australia has plenty to complain about, but this chart is a useful reminder: the Lucky Country remains luckier than most realise.

It shows what Australia owes the world, less what the world owes us. Net foreign liabilities have fallen from their 2016 peak to levels last seen in the mid-1980s.

Strong export income from our red and black rocks helped. Three decades of compulsory super have also given Australians a much larger stake in assets overseas. And because Australian borrowers are well protected against swings in the dollar — through Australian-dollar borrowing, hedging and foreign-currency assets — we are less exposed when global markets turn ugly.

So yes: you’d rather be us.

The awkward part is what the chart may also be telling us. Australian capital has become increasingly comfortable investing overseas as domestic investment has declined. Diversification is no bad thing — our super funds should search the world for the best opportunities. But when more of our savings keep finding a home elsewhere, it is worth asking what Australia is giving them to stay for.

The balance sheet looks healthier. The investment story underneath it is less flattering.


The Skim

Designed to be skimmed. Your shortcut to being informed without the noise. Select “Read our take” for FinSec’s full interpretation.

That power bill wasn’t your imagination. For four days in June, South Australia’s wind farms ran at about 4.5% of capacity and spot prices twice hit the $20,300 ceiling. The problem wasn’t the renewables. It was what happened when they went missing for four days

Read our take

Companies paying tax like never before? More large companies are paying tax than ever, yet the total they paid fell by $8.2 billion. Just 2.2% of them supplied more than half of it. We’re very good at taxing yesterday’s winners, and less good at producing tomorrow’s.

Read our take

Family trusts: better than feared, with a catch. The draft changes give existing trusts a way around the 30% minimum tax. The catch is that it costs flexibility you may want later. It’s one to watch, not to act on yet.

Read our take

The Distance Tax Singapore will pay you S$30,000 to move in with your parents. In Australia, families pay their own version in petrol, leave days and careers quietly scaled back. Most wealth transfer plans cover who gets what, but not who turns up.

Read our take

Switzer takes a turn on the roundabout. Nvidia invested in Firmus, supplied it and signed on as a customer. Then the ASX float was pulled. AI will still change the world, but public investors want to know where the traffic’s coming from

Read our take


152,000 years

That’s how long it would take to count Australia’s $4.8 trillion superannuation pool at one dollar a second.

Compulsory super is only 34 years old. Australia built one of the world’s largest pools of retirement capital in a single working lifetime. That is not slow accumulation. It is a financial superpower built almost from scratch.

Australia does not have a shortage of capital. We just need to give it a reason to stay.


Friday Footnotes

A new Buffett in the chair. Warren Buffett, 96, has stepped back to chairman emeritus of Berkshire Hathaway, having chaired it since 1970. His son Howard, 71 and a board member since 1993, takes the chair, and Greg Abel continues as CEO. It’s succession planning, Omaha style: take 56 years, then keep it in the family.

‘Reader, they studied her’. Charlotte Brontë’s Jane Eyre, published in 1847, is now required reading for ninth-grade students in China.
The state-run Beijing Daily recommends it as an antidote to online fiction obsessed with looks and wealth.

There is a certain irony in the mouthpiece of a government keen on prescribed paths recommending a heroine famous for refusing hers. Her most famous line isn’t “he married me”. It’s “Reader, I married him”.

One for the golf enthusiasts. Even the cat only needed one committee’s blessing.

And lastly: the permission economy meets Dan the Paper Towel Capital letters, apparently, are optional.

Sources

Deloitte Access Economics – Business Outlook; Treasury – 2026 Intergenerational Report; Treasury – Intergenerational Report 2026 fact sheet; Parliamentary Budget Office – Guide to the 2026 Intergenerational Report; IFM, via Pinnacle Around the Grounds, 3 September 2026; ABS – Australian National Accounts, June 2026; ABS – Wage Price Index, June 2026; Ashley Owen – Australia’s declining economic growth is mostly just population growth; ABS – Labour Force, Australia, July 2026; Productivity Commission – Productivity update, September 2026; Budget 2026-27, Statement 3; Jobs and Skills Australia – Employment Projections; Mandala for the AICD – The Stagnant Nation; Epoch AI – The plunging price of thought; BlackRock, via Pinnacle Around the Grounds, 10 September 2026; Robert Solow – “We’d better watch out”, New York Times Book Review, 12 July 1987; Paul A. David – “The Dynamo and the Computer”, American Economic Review, May 1990; Zenith Investment Partners – Monthly Market Report, August 2026; CompaniesMarketCap – Nvidia market capitalisation (A$7.9 trillion, October 2026); CEIC – ASX market capitalisation (A$3.24 trillion, September 2026). Switzer – Why the high interest rate era is here to stay; CommBank – Inflation rises to 4%; Reuters – Australia inflation stubbornly high in August; RBA – Financial Stability Review, October 2026; Deloitte Access Economics – Business Outlook; Nine – Is a recession coming?; AFR – Why high interest rates aren’t hurting households like they used to; Switzer – Feature Daily (outer-suburb arrears); Budget 2026-27, Budget Paper No. 1; Budget 2026-27, Statement 3: Fiscal Strategy and Outlook (payments 26.8% of GDP; gross debt $1,051bn at June 2027); Parliamentary Budget Office – Guide to the 2026 Intergenerational Report (payments of almost $830bn); Budget 2019-20, Budget Paper No. 1 (pre-COVID payments); ABC – Australia’s national debt has hit $1 trillion (AOFM data); Pinnacle Around the Grounds, 8 October 2026 (Australian 10-year yield). Parliamentary Budget Office – 2026-27 National Fiscal Outlook; YCharts – Shiller CAPE Ratio; The Trading Tools – Shiller CAPE history; AOFM – Role of the CGS market; Victoria 2026-27 Budget summary (net debt); Straight Talk podcast, 15 October 2026. ABC; Daily Energy News, SupportGoWhere, Proximity Housing Grant (Families); HDB, Proximity Housing Grant (Singles); MND, Affordable Homes, Closer Families, Stronger Ties (2015); The Straits Times, HDB disburses $550m under Proximity Housing Grant; ATO, Granny flat arrangements and CGT. ABS, Balance of Payments and International Investment Position, June 2026; IMF, World Economic Outlook, October 2026. Adviser Voice, June 2026. ABS – Births, Australia, 2024; ABS – National, state and territory population, March 2026. Sources: Switzer, 16 October 2026; ABC News, 13 October 2026. AMP’s weekly updates and Oliver’s Insights, Morgan Stanley, Challenger (Kearns), Berkshire Hathaway and the AFR.

Subscribe to the FinSec View here

Published On: October 20th, 2026Categories: FinSec Post, The FinSec View